Figures & data
Table 1 Primers used for real-time PCR
Figure 1 Characterizations of ZnO NPs.
Notes: (A) Scanning electron microscopy image of ZnO NPs; scale bar =500 nm. (B) Hydrodynamic diameter.
Abbreviation: ZnO NPs, zinc oxide nanoparticles.
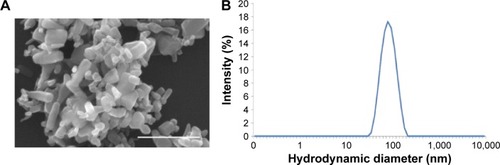
Figure 2 Viability of HaCaT cells and cell cycle alterations in HaCaT cells after exposure to ZnO NPs.
Notes: (A) Viability of HaCaT cells treated with ZnO NPs at different concentrations for 24, 48, and 72 hours. (B) Images of HaCaT cells in cell cultures treated without or with ZnO NPs at 0.5, 20, and 50 μg/mL for 48 hours monitored by an inverted phase-contrast microscope. Scale bars =40 μm. (C) Flow cytometry analysis of cell cycle change. The propidium iodide, a DNA-specific intercalating dye, was used to stain cells. 64: diploid cells with one-chromatid chromatin (G1 phase); 128: diploid cells with two chromatid chromatin (G2/M phase). (D) The quantitative analysis of cells at different phases based on flow cytometry data. The results showed that ZnO NP treatment caused the cell cycle arrest in G2/M checkpoint. (E) The expression of specific marker genes CyclinB1 and CDK1 in G2/M cell cycle arrest was decreased, and the expression of PCNA which was used for estimating cell proliferation was decreased in HaCaT cells after exposure to ZnO NPs for 24 hours as measured by real-time PCR.
Abbreviations: ZnO NPs, zinc oxide nanoparticles; PCR, polymerase chain reaction; PI, propidium iodide; h, hours.
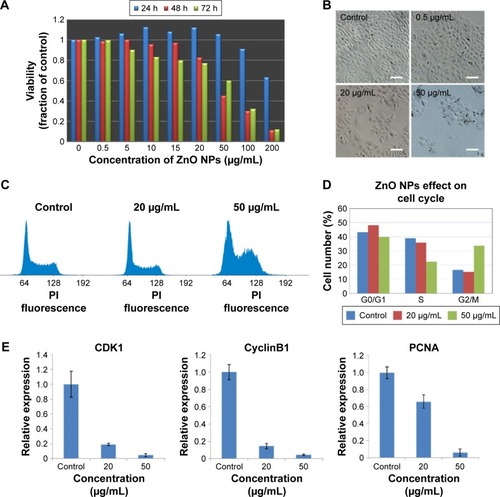
Figure 3 The alterations of chromatin modifications and the expression of histone methyltransferase genes and acetyltransferase genes in HaCaT cells after exposure to ZnO NPs.
Notes: (A) Nuclear changes induced by ZnO NPs were detected by a fluorescence microscope. HaCaT cells were grown on glass coverslips, untreated (control) or treated for 24 hours with ZnO NPs (20 or 50 μg/mL) and stained with DAPI (blue). Scale bars =10 μm. Percentages of the nucleus in different sizes (large, medium, small) after 24-hour exposure to ZnO NPs at 20 and 50 μg/mL. Number of evaluated cells in each group was 300. (B) The histone H3K9 in nucleus in HaCaT cells undergoes increased methylation after ZnO NPs treatment. HaCaT cells were grown on glass coverslips, untreated (control) or treated for 24 hours with ZnO NPs (20 or 50 μg/mL) and stained with DAPI (blue). The same cells were also stained with the H3K9me2 antibody, followed by anti-rabbit secondary antibody (green). Scale bars =10 μm. (C) A decrease in global H4K5ac and an increase in global H3K9me2 were observed after treatment with 0.5, 20, and 50 μg/mL ZnO NPs compared with the control group. Histone H3 was used as a protein loading control. (D) Histogram showing the mean gray values of the Western blot bands for histone modifications. The experiments were repeated three times using biologically independent samples. (E) ZnO NPs induced the increased expression of methyltransferase genes G9a and GLP; the expression of both G9a and GLP genes was increased at 50 μg/mL, whereas the expression of only GLP gene was increased at 20 μg/mL. (F) The expression of acetyltransferase genes GCN5, P300, and CBP was decreased compared to control. The relative expression value of the control group (untreated) was defined as 1.0. The actin gene was used as an internal control. The data are represented as the mean ± standard error for triplicate quantitative PCRs for each concentration from three independent experiments.
Abbreviations: ZnO NPs, zinc oxide nanoparticles; DAPI, 4,6-diamidino-2-phenylindole; PCR, polymerase chain reaction.
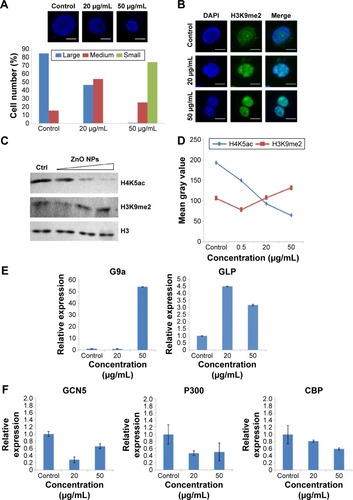
Figure 4 ZnO NPs induced the production of ROS in HaCaT cells.
Notes: Cells grown in a culture plate were treated with nanoparticles at 20 μg/mL for (A) 0, (B) 6, or (C) 24 hours, or (D) 10 days, washed with cold phosphate-buffered saline, and then incubated with DCFH-DA. The samples were measured by flow cytometry. (E) Relative analysis of each sample by software FlowJo 7.6. The x-axis shows the intensity of fluorescence representing the level of ROS, and the y-axis shows the measured cell quantity.
Abbreviations: ROS, reactive oxygen species; DCFH-DA, 2′,7′-dichlorodihydrofluorescein diacetate.
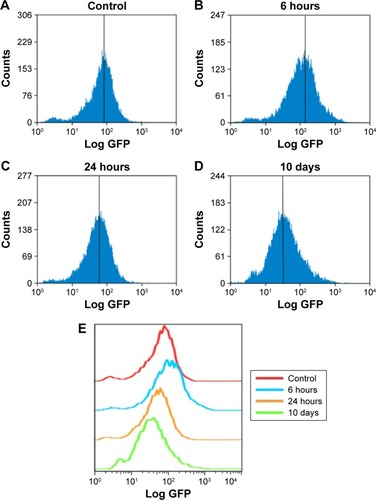
Figure 5 The nucleus in HaCaT cells showed increased γ-H2AX signals after ZnO NPs treatment.
Notes: (A) HaCaT cells were grown on glass coverslips, untreated (control) or treated (20 or 50 μg/mL) for 24 hours with ZnO NPs and stained with DAPI (blue). The same cells were also stained with the γ-H2AX antibody, followed by the anti-rabbit secondary antibody (green). Scale bars =10 μm. (B) An increase in γ-H2AX signals was observed after treatment with 20 and 50 μg/mL ZnO NPs compared with the control group. Tublin was used as a protein-loading control.
Abbreviations: ZnO NPs, zinc oxide nanoparticles; DAPI, 4,6-diamidino-2-phenylindole.
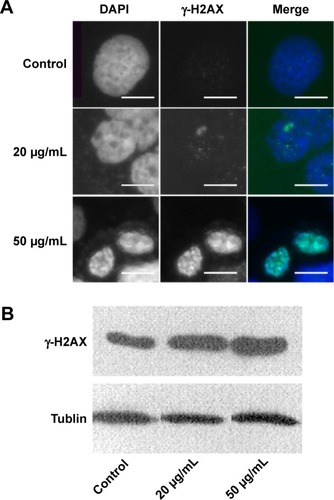
Figure 6 Analysis of nanomaterial uptake by cells.
Notes: (A) TEM images of HaCaT cells treated with ZnO NPs at 20 and 50 μg/mL for 24 hours: (a) No ZnO NP was observed in the control cytoplasm and nucleus. (b) The aggregates of ZnO NPs were observed dispersedly in the cytoplasm (arrows), but not in the nucleus, after cells were treated with ZnO NPs for 24 hours. (c) The nucleus was surrounded by the aggregates of ZnO NPs (arrows), but no ZnO NP was observed in the other area of the cell. (d) The membrane of mitochondria was squeezed by ZnO NPs (arrows). Images e–h are the high-magnification images of the black boxed regions of images a–d. Scale bars: 5 μm in a and b, 1 μm in c and d, and 500 nm in e–h. (B) Flow cytometry analysis of nanoparticle uptake in HaCaT cells exposed to ZnO NPs for 24 hours. The SSC intensity representing granularity of a cell and the FSC representing the size of a cell were analyzed with flow cytometry. Nanomaterial uptake/surface adsorption is reflected by an increase in the SSC of cell populations.
Abbreviations: TEM, transmission electron microscopy; ZnO NPs, zinc oxide nanoparticles; SSC, side scatter; FSC, forward scatter; N, nucleus.
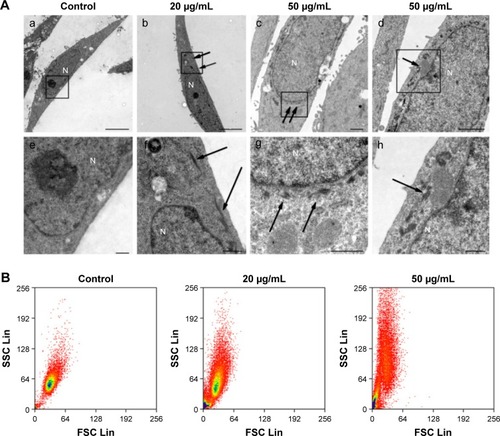
Figure 7 ZnO NPs induced HaCaT cell apoptosis.
Notes: (A) Scanning electron microscopy images of HaCaT cell topography after exposure to ZnO NPs for 24 hours at different concentrations. The normal HaCaT surface was covered by abundant microvillus, whereas after exposure to ZnO NPs, the microvillus was decreased significantly. Compared to normal HaCaT cells, the apoptotic body appeared (white arrows) on the surface of treated cells. Scale bars =10 μm. (B) Flow cytometry results of Annexin-V-FITC and PI assay. HaCaT cells were treated without (control) or with ZnO NPs (20 or 50 μg/mL) for 24 hours. A cell stained by Annexin-V-FITC− and PI− is shown in the lower left area, one stained by Annexin-V-FITC+ and PI− is shown in the lower right area, one stained by Annexin-V-FITC− and PI+ is shown in the upper left area, and one stained by Annexin-V-FITC+ and PI+ is shown in the upper right area.
Abbreviations: ZnO NPs, zinc oxide nanoparticles; FITC, fluorescein isothiocyanate; PI, propidium iodide.
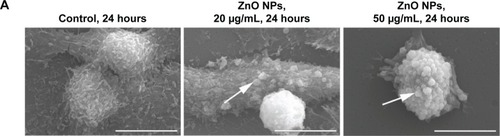
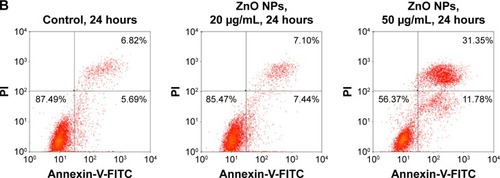
Figure 8 The expression of apoptotic relevant genes in HaCaT cells after exposure to ZnO NPs for 24 hours measured by real-time PCR.
Notes: (A) Mitochondrial apoptotic pathway-relevant Bcl family genes. ZnO NPs induced the increased expression of proapoptotic gene Bax and antiapoptotic gene Bcl-2 and induced the decreased expression of antiapoptotic gene Bcl-xl. (B) The expression of apoptotic genes Noxa and Puma was increased, and that of Hsp70 was unaffected. The relative expression value of the control group (untreated) was defined as 1.0. The actin gene was used as an internal control. The data are represented as the mean ± standard error for triplicate quantitative PCRs for each concentration from three independent experiments.
Abbreviations: ZnO NPs, zinc oxide nanoparticles; PCR, polymerase chain reaction.
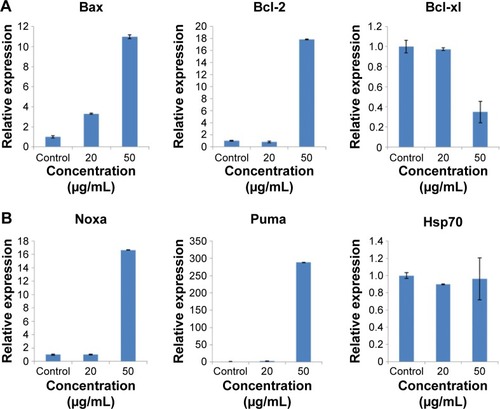
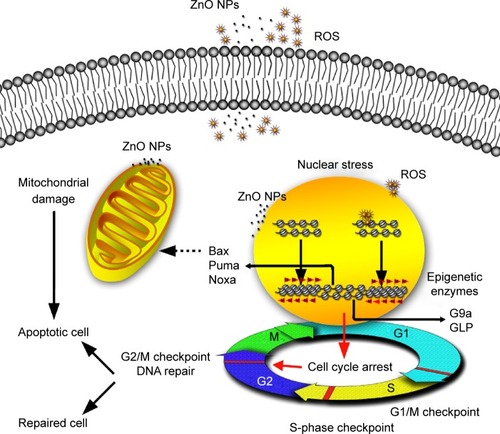
Figure 9 Possible mechanisms involved in ZnO NP-induced changes in HaCaT cells at epigenetic and molecular levels.
Notes: ZnO NPs release ROS extra- and intracellularly. The transient ROS explosion and the ZnO NPs accumulated in perinucleus might result in G2/M cell cycle arrest associated with the nuclear stress (DNA damage and chromatin structure remodeling) before the viability of HaCaT cells was reduced. When the nucleus is subjected to stress, histone lysine residue modifications (H4K5ac and H3K9me2) near the DNA break regions might provide signals for recruitment of DNA repair proteins, resulting in the chromatin structure remodeling such as chromatin condensation and nucleus shrinking. The G2/M checkpoint prevented DNA-damaged cells from entering mitosis to allow for the repair of DNA prior to mitosis; the checkpoint signaling might activate pathways that lead to apoptosis if the damage is irreparable. The upregulation of the proapoptotic Bcl-2 family relevant genes Bax, Noxa, and Puma that are related to mitochondrial apoptotic pathway indicates that the apoptosis induced by ZnO NPs may be involved in mitochondrion damage. The mitochondrion squeezed by ZnO NPs directly may also result in mitochondrion dysfunction and subsequent cell apoptosis.
Abbreviations: ZnO NPs, zinc oxide nanoparticles; ROS, reactive oxygen species.