Figures & data
Figure 1 SEM photos of nHA/PA66 membrane: micropore surface (A) and spongy surface (B).
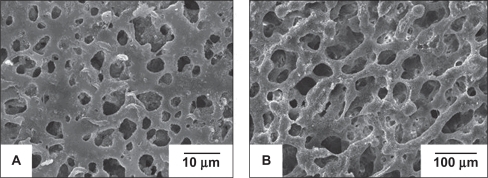
Figure 2 SEM micrographs of the BMSCs cultured on the nHA/PA66 membranes for 24 h (A) and 96 h (B), respectively.
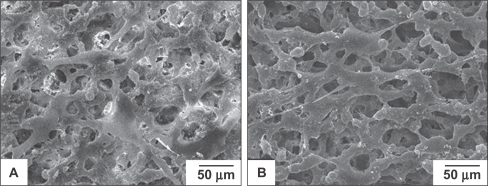
Figure 3 The cellular morphology and proliferation of BMSCs cultured with nHA/PA66 membrane and BMSCs (control) under inverted phase contrast microscope (magnification:200×) at day 4 (A, B) and day 7 (C, D). M stands for nHA/PA66 membrane.
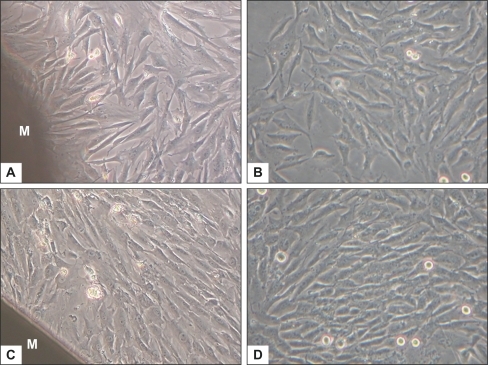
Figure 4 The proliferation of BMSCs (control) and BMSCs cultured with nHA/PA66 membrane at various incubation periods.
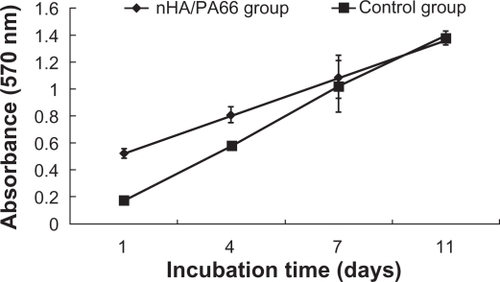
Table 1 Distribution in the different phases of BMSCs (control) and BMSCs cultured with nHA/PA66 membrane
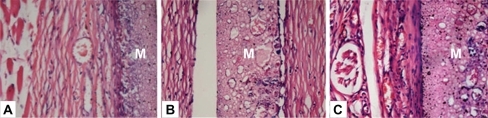
Figure 5 Hematoxylin/eosin-stained sections of subcutaneously-implanted nHA/PA66 membrane and surrounding tissue, which were harvested at 1 (A), 4 (B), and 8 (C) weeks post-implantation (magnification:400×). In the photos, M denotes the nHA/PA66 membrane.