Figures & data
Table 1 Particle size and transparency of different micelle solutions
Figure 1 Size distribution (by volume) of CsA eyedrops obtained by DLS for (A) O7 MS and (B) Restasis.
Note: Bar refers to the differential volume (%), and line graph refers to the cumulative volume (%).
Abbreviations: CsA, cyclosporine A; DLS, dynamic light scattering; MS, micelle solution.
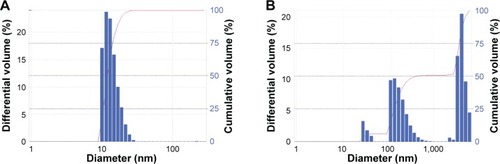
Table 2 Changes in particle size of MS-CsA stored at room temperature and 4°C
Table 3 pH and osmolarity analysis of different micelle formulations
Figure 2 Changes in chemical stability (remaining CsA) of MS-CsA stored at (A) room temperature and (B) 4°C at different time intervals over 60 days.
Note: Data expressed as mean ± standard deviation (n=3).
Abbreviation: MS-CsA, micelle solution of cyclosporine A.
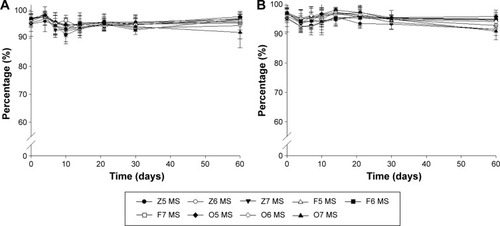
Figure 3 (A) STT scores in the AS-treated group (control) at different time points and (B) according to CsA-formulation treatment in the rabbit dry-eye model.
Notes: *P<0.05 versus STT score of day 1; #P<0.05 (one-way ANOVA between the three groups). Data expressed as mean ± standard deviation (n=8).
Abbreviations: AS, atropine sulfate (1% solution); STT, Schirmer tear test; CsA, cyclosporine A; MS, micelle solution; ANOVA, analysis of variance.
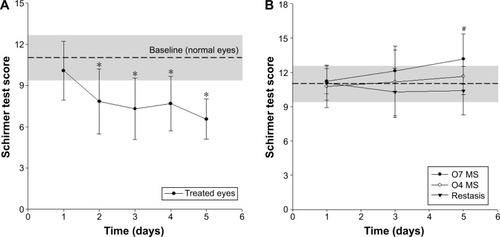
Table 4 Schirmer tear test scores with cure
Table 5 Average conjunctival goblet-cell density
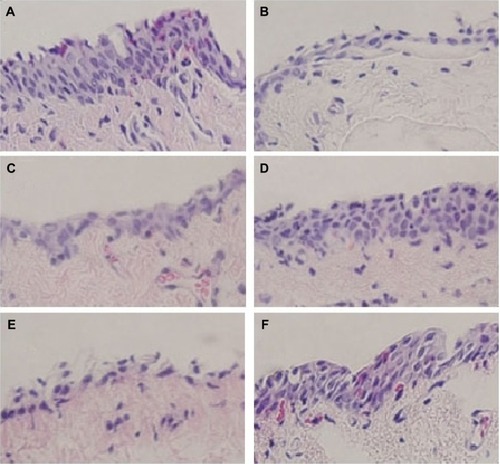
Figure 4 Images of histologic sections from the rabbit conjunctiva stained with H&E.
Notes: (A) Administration of normal saline only; (B) administration of 1% atropine sulfate solution only; (C) AS + NS administration in group 1; (D) AS + O7 administration in group 1; (E) AS + NS administration in group 3; (F) AS + Restasis administration in group 3. Goblet cells are stained purple and located in the superficial epithelium. Epithelia in (B), (C), and (E) were thinned with loss of goblet cells. Goblet-cell morphology in (D) was relatively well formed. Magnification 40×. All solutions administered at 50 μL.
Abbreviations: AS, atropine sulfate (1% solution); H&E, hematoxylin and eosin; NS, normal saline.