Figures & data
Figure 1 Characterizations of MNP nanoformulation.
Notes: (A) Transmission electron microscopy of TIMP1-loaded MNPs; (B) binding kinetics of TIMP1 (5 μg) to MNPs: (a) effect of MNPs amount with respect to percentage TIMP1 binding and (b) effect of time with respect to percentage TIMP1 binding; (C) in vitro release data: cumulative percentage release profile of TIMP1 from MNP nanoformulation (5 μg of TIMP1 loaded onto 5 μg MNPs) was studied in PBS (pH 7.4) with 0.1% sodium azide at 37°C using 100 kD Micro Float-A-Lyzer (Spectrum Labs, Cincinnati, OH, USA) dialysis membrane. Standard errors are shown for the mean of triplicate samples.
Abbreviations: TIMP1, tissue inhibitor of metalloproteinase-1; MNPs, magnetic nanoparticles; PBS, phosphate-buffered saline.
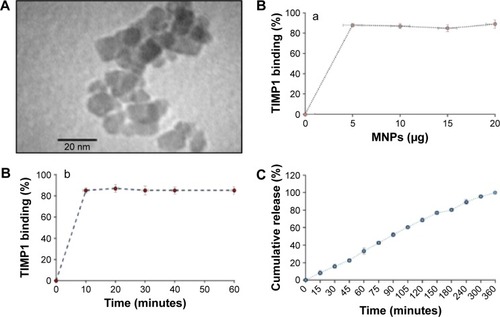
Table 1 In vitro BBB model TEER values
Figure 2 MNPs + TIMP1 nanoformulation (NF) transmigration study using in vitro BBB model.
Notes: (A) Transmigration efficiency evaluation: MNPs, free TIMP1, and MNPs + TIMP1 NF were added in the upper chamber of the transwells, and samples were tested for transmigration ability in the presence or absence of static magnet (0.8 T) placed underneath the cell culture plate for the 2 hours treatment; transmigrated samples were collected from the bottom chamber, centrifuged, and estimated for iron content using iron assay; (B) effect of magnetic treatment time with respect to NF transmigration efficiency: samples from the lower chamber at different time points, ie, 2, 4, and 6 hours, were collected, and transmigrated MNPs + TIMP1 NF was collected from the bottom chamber, centrifuged, and calculated for iron content using iron assay. (C) BBB integrity analysis using the FITC–dextran transport assay: FITC–dextran transport was measured for MNPs/MNPs + TIMP1 NF after 2 hours’ magnetic treatment, and FITC–dextran (molecular weight 40,000 Da) was added to the upper chamber of the insert. After 30 minutes’ incubation, relative fluorescence unit from the lower chamber of the transwell was measured. Results were expressed as % FITC–dextran transport with respect to the untreated control cultures (−ve control = no cell and +ve control = with all BBB cells) and represented as mean ± SE of independent experiments. ***P≤0.001.
Abbreviations: BBB, blood–brain barrier; SE, standard error; FITC, fluorescein isothiocyanate; TIMP1, tissue inhibitor of metalloproteinase-1; NF, nanoformulation; MNPs, magnetic nanoparticles; NS, not significant; ctrl, control; M, Magnet.
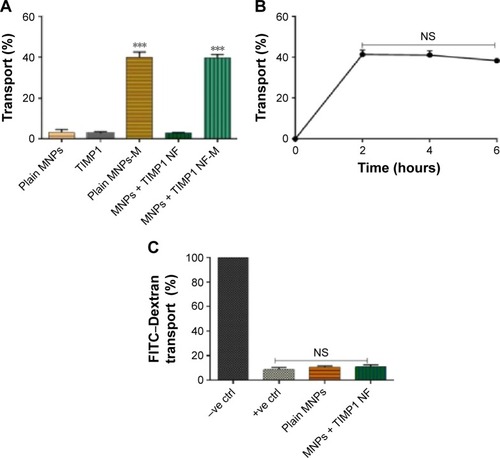
Figure 3 Cytotoxicity studies in SK-N-MC cells for free and TIMP1 + MNPs nanoformulation components.
Notes: Figure shows the percentage of cells viable after treatment with different amounts of MNPs (5–20 μg/mL) or free TIMP1 (50 ng–1 μg) or MNPs + TIMP1 nanoformulation. SK-N-MC cells (1×10⁵ cells) were grown in the six-well culture plates, and cells were infected with 20 ng of HIV-1 clade B overnight. Unbound virus was washed, and cells were infected for 7 days. On fifth day of infection, TIMP1/MNPs/MNPs + TIMP1 was added at different amounts into the respective wells and incubated for 48 hours. Seven days postinfection, cell viability was measured using the MTT assay. *P≤0.05.
Abbreviations: HIV, human immunodeficiency virus; TIMP1, tissue inhibitor of metalloproteinase-1; NF, nanoformulation; MNPs, magnetic nanoparticles; NS, not significant.
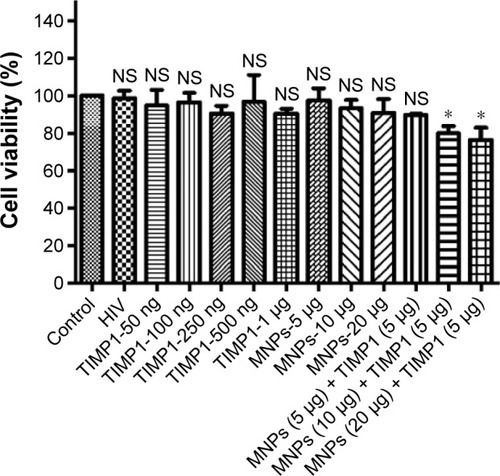
Figure 4 Quantitative analysis of uptake of FITC-tagged MNPs + TIMP1 NF in SK-N-MC cells using the flow cytometry.
Notes: SK-N-MC cells were exposed to 5 μg of FITC-labeled MNPs + TIMP1 NF for 3, 6, 12, and 24 hours. Uptake of the NF was measured by the fluorescence in the SK-N-MC cells using the flow cytometry. For each sample, 10,000 events were collected, and cells were gated based on the cells without NF (pink-line histogram) or control (A). Colored histograms show cells positive for NF with shifted mean fluorescence intensity compared to controls. The representative figures for uptake at 3 hours (B) and 24 hours (C) are presented. Histograms represent cells treated with 5 μg of FITC-tagged NF for 3 hours (blue) and 24 hours (orange) (D), which show 49.85% and 50% cells are positive for MNPs + TIMP1 NF, respectively, when compared with the untreated cells. Histograms show an overlay for time points (3 and 24 hours) (D).
Abbreviations: FITC, fluorescein isothiocyanate; TIMP1, tissue inhibitor of metalloproteinase-1; NF, nanoformulation; MNPs, magnetic nanoparticles.
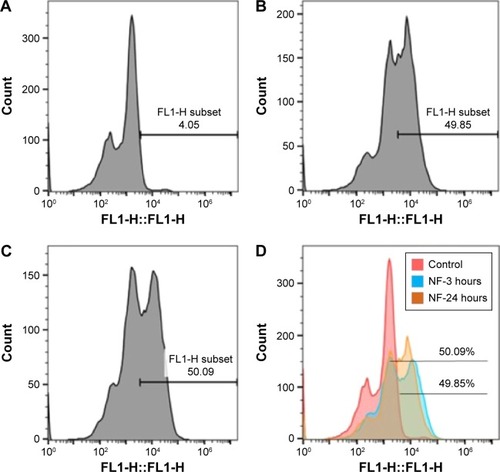
Figure 5 Decreased HIV infection levels in SK-N-MC cells treated with free TIMP1 or MNPs + TIMP1 NF.
Notes: SK-N-MC (1×10⁵ cells) were grown in the six-well culture plates, and cells were infected with 20 ng of HIV-1 clade B overnight. Unbound virus was washed with PBS, and cells were infected for 7 days. On fifth day of infection, free TIMP1/MNPs + TIMP1 NF was added into the respective wells and incubated for 48 hours. Seven days postinfection, HIV infection levels were measured using the p24 ELISA. *P≤0.05, **P≤0.01.
Abbreviations: TIMP1, tissue inhibitor of metalloproteinase-1; NF, nanoformulation; MNPs, magnetic nanoparticles; HIV, human immunodeficiency virus; PBS, phosphate-buffered saline; ELISA, enzyme-linked immunosorbent assay; NS, not significant.
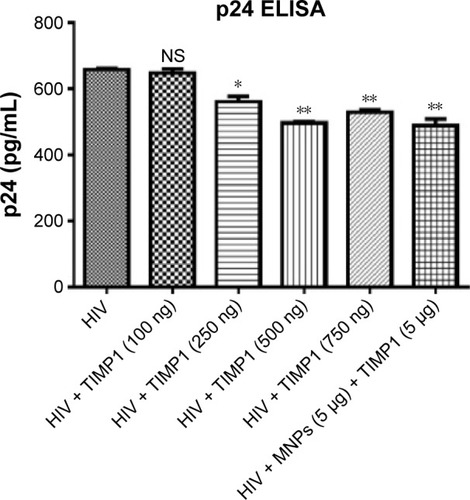
Figure 6 Decreased ROS production in HIV-infected SK-N-MC cells treated with free TIMP1 or MNPs + TIMP1 NF.
Notes: SK-N-MC (1×10⁵ cells) were grown in the six-well culture plates, and cells were infected with 20 ng of HIV-1 clade B overnight. Unbound virus was washed with phosphate-buffered saline, and cells were infected for 7 days. On fifth day of infection, TIMP1/MNPs/MNPs + TIMP1 NF was added into the respective wells and incubated for 48 hours. Seven days postinfection, ROS production was measured using the ROS assay. *P≤0.05, **P≤0.01, ***P≤0.001.
Abbreviations: ROS, reactive oxygen species; RFU, relative fluorescence unit; TIMP1, tissue inhibitor of metalloproteinase-1; NF, nanoformulation; MNPs, magnetic nanoparticles; HIV, human immunodeficiency virus; NS, not significant.
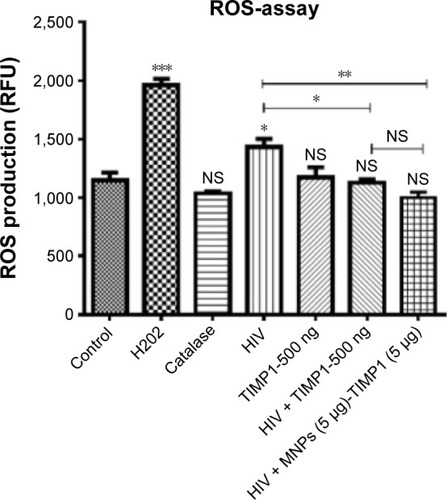
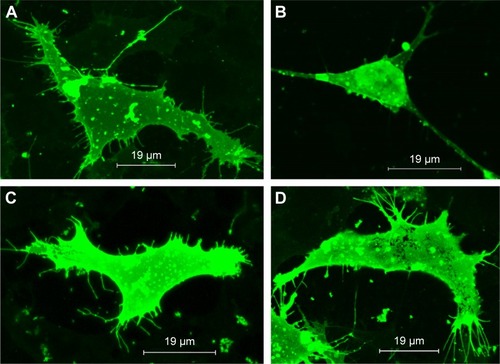
Figure 7 TIMP1 recovers spine density in human immunodeficiency virus (HIV)-infected neuronal cells.
Notes: SK-N-MC cells were infected with HIV for 7 days. On the fifth day of HIV infection, free TIMP1 or MNPs + TIMP1 nanoformulation was added to the culture. (A) Control cells: long spines in high number can be observed on a dendritic length, (B) HIV-infected cells: loss of number of spines can be observed on a dendritic length when compared to the control. (C) HIV-infected cells in the presence of free TIMP1: recovery of spines on the dendrite length when compared to the HIV-infected cells. (D) HIV-infected cells in the presence of MNPs + TIMP1 NF: recovery of spines on the dendrite length when compared to the HIV-infected cells.
Abbreviations: TIMP1, tissue inhibitor of metalloproteinase-1; MNPs, magnetic nanoparticles; HIV, human immunodeficiency virus; NF, nanoformulation.