Figures & data
Figure 1 Cellular components of the blood–brain barrier (cross-sectional view).Citation3
Notes: Adapted from Hawkins BT, Davis TP. The blood-brain barrier/neurovascular unit in health and disease. Pharmacological Reviews. 2005;57(2):173–185. Copyright © 2005 by The American Society for Pharmacology and Experimental Therapeutics.Citation3
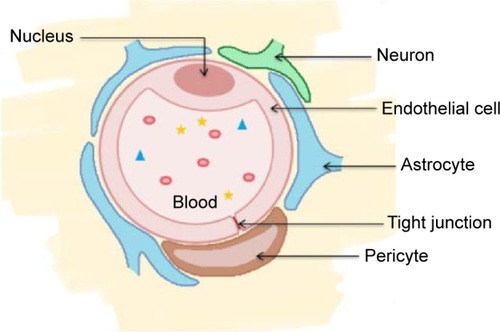
Figure 2 Diagram of the in vitro BBB model.
Abbreviations: BBB, blood–brain barrier; b.End3, mouse brain endothelial cell.
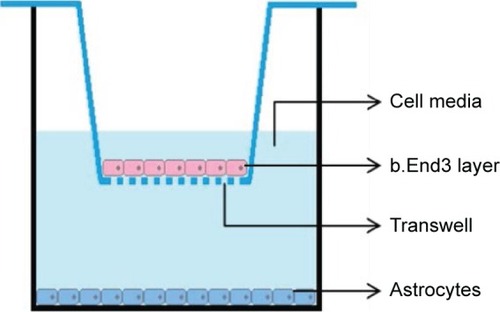
Table 1 DLS and zeta potential of five SPION samples
Figure 3 TEM image of the iron oxide core in GGC.
Notes: Magnification 75,000×. Reproduced from Shi D, Sun LL, Mi G, et al. Controlling ferrofluid permeability across the blood-brain barrier model. Nanotechnology. 2014; 25(7):075101. © IOP Publishing. Reproduced with permission. All rights reserved.Citation21
Abbreviations: GGC, glycine, glutamine acid, and collagen; TEM, transmission electron microscopy.
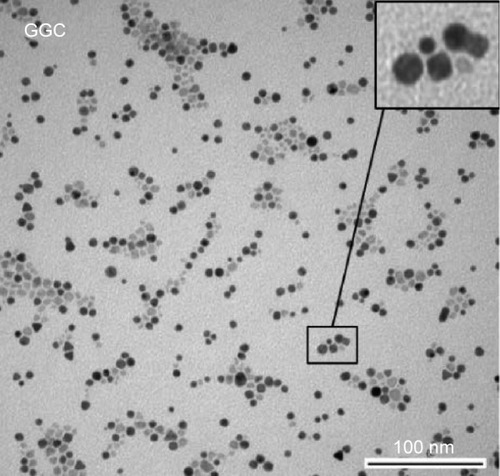
Figure 4 XRD pattern of SPIONs.
Abbreviations: SPION, superparamagnetic iron oxide nanoparticle; XRD, X-ray diffraction.
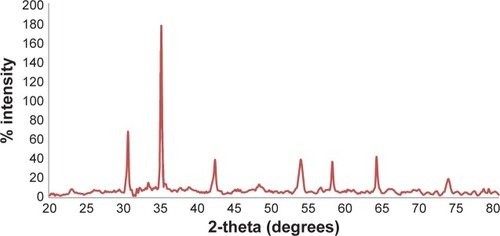
Figure 5 Permeability of FITC-dextran across the cocultured BBB model.
Notes: Data are shown as the mean ± SD; N=3, *P<0.05 compared with 24 hours.
Abbreviations: BBB, blood–brain barrier; FITC, fluorescein isothiocyanate; SD, standard deviation.
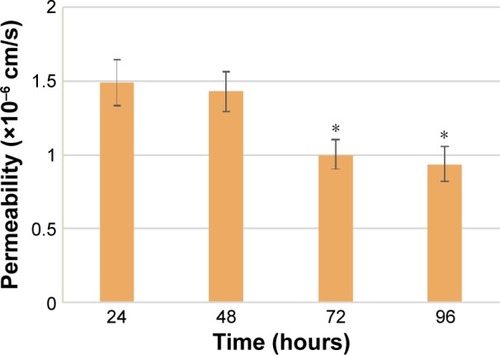
Figure 6 Comparison of the TEER values between the two different BBB models.
Notes: Data are shown as the mean ± SD; N=3, *P<0.05 compared with the nonastrocyte-cultured BBB model.
Abbreviations: BBB, blood–brain barrier; SD, standard deviation; TEER, transendothelial electrical resistance.
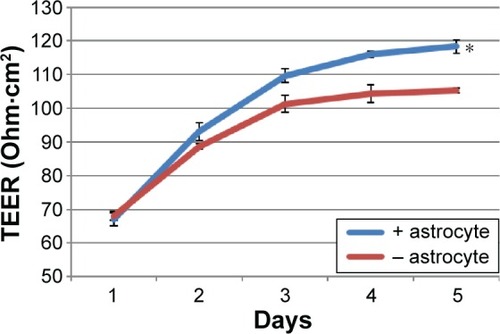
Figure 7 Essential junction proteins expressed by b.End3 when cocultured with astrocytes.
Notes: Cells were stained with anti-ZO1-conjugated FITC (green) and counterstained with DAPI (blue). Magnification 40×.
Abbreviations: FITC, fluorescein isothiocyanate; b.End3, mouse brain endothelial cell.
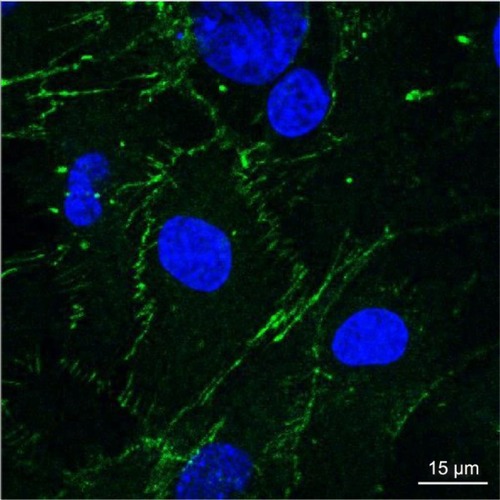
Figure 8 Permeability of the SPIONs across the BBB model.
Notes: Data are shown as the mean ± SD; N=3, *P<0.05 compared with GGB.
Abbreviations: BBB, blood–brain barrier; BPC, bovine serum albumin, polyethylene glycol, and collagen; CPB, collagen, polyvinyl alcohol, and bovine serum albumin; GGB, glycine, glutamic acid, and bovine serum albumin; GGC, glycine, glutamic acid, and collagen; GGP, glycine, glutamic acid, and polyvinyl alcohol; SD, standard deviation; SPION, superparamagnetic iron oxide nanoparticle.
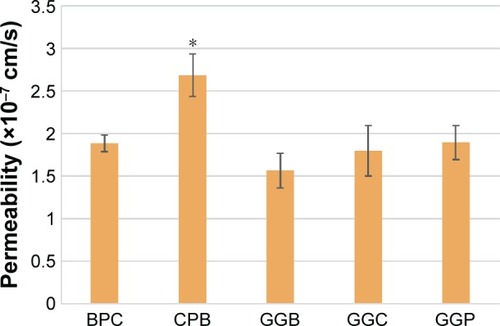
Figure 9 TEM thin sections of cell uptake of SPIONs.
Notes: (A) Cell uptake of CPB; magnification 3,000×. (B) Cell uptake of GGB; magnification 3,000×. (C–E) Endocytosis steps of cell uptaking CPB; (C and D) magnification 10,000×; (E) magnification 5,000×. (F) Exocytosis step of cell uptaking CPB; magnification 30,000×. The white circle and arrows in A and B indicate the SPIONs inside and attached to the cell. (C–F) Black arrows indicate SPIONs.
Abbreviations: CPB, collagen, polyvinyl alcohol, and bovine serum albumim; GGB, glycine, glutamic acid, and bovine serum albumin; SPION, superparamagnetic iron oxide nanoparticle; TEM, transmission electron microscopy.
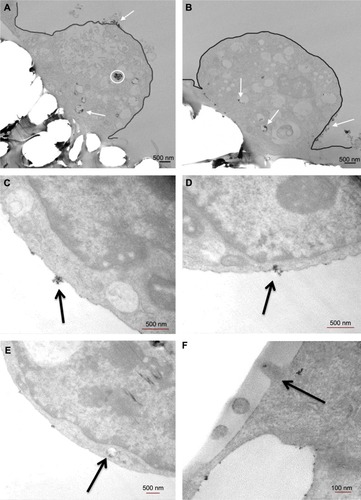
Figure 10 Permeability of the four SPION samples (GGB, GGC, GGP, and BPC) by hydrodynamic diameter (DLS).
Abbreviations: BPC, bovine serum albumin, polyethylene glycol, and collagen; DLS, dynamic light scattering; GGB, glycine, glutamic acid, and bovine serum albumin; GGC, glycine, glutamic acid, and collagen; GGP, glycine, glutamic acid, and polyvinyl alcohol; SPION, superparamagnetic iron oxide nanoparticle.
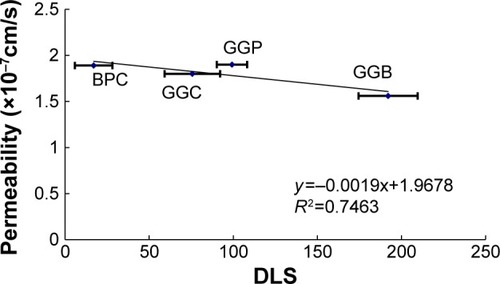
Figure 11 Permeability of the four SPION samples (GGB, GGC, GGP, and BPC) by zeta potential.
Abbreviations: BPC, bovine serum albumin, polyethylene glycol, and collagen; GGB, glycine, glutamic acid, and bovine serum albumin; GGC, glycine, glutamic acid, and collagen; GGP, glycine, glutamic acid, and polyvinyl alcohol; SPION, super-paramagnetic iron oxide nanoparticle.
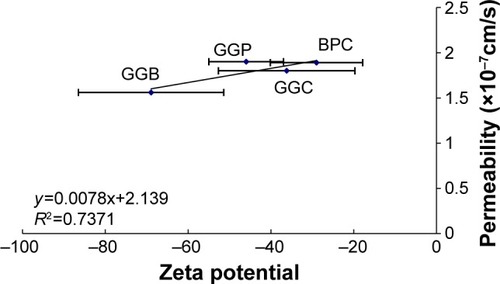
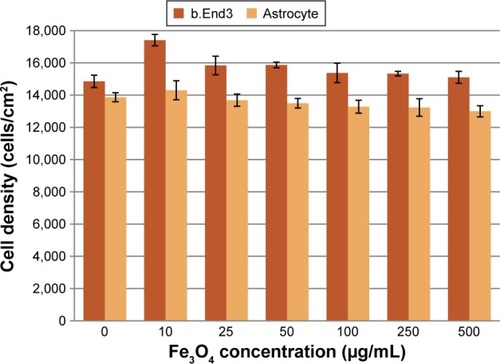
Figure 12 One-day cytotoxicity assay for SPION samples.
Notes: Data are shown as the mean ± SD; N=3. No statistical difference was observed.
Abbreviations: b.End3, mouse brain endothelial cell; SD, standard deviation; SPION, superparamagnetic iron oxide nanoparticle.