Figures & data
Figure 1 Peptide-coated AuNPs for in vivo targeting of angiogenesis.
Notes: CAM assay was performed with AuNPs functionalized with three different peptides: proangiogenic; antiangiogenic, and a scrambled peptide as control.
Abbreviations: AuNPs, gold nanoparticles; CAM, chorioallantoic membrane.
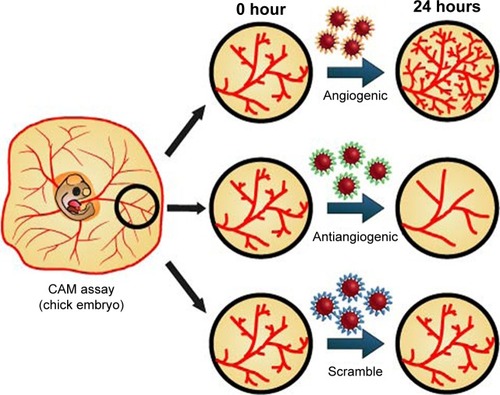
Figure 2 CAM assay.
Notes: (A) Position of the silicon O-rings in the developing blood vessels plexus of the yolk sac membrane. (B) RGB image of the O-ring interior used for counting the number of veins. (C) Green channel of the same image. (D) Binary of the segmented image used to calculate the number of branches.
Abbreviations: CAM, chorioallantoic membrane; RGB, red, green, and blue.
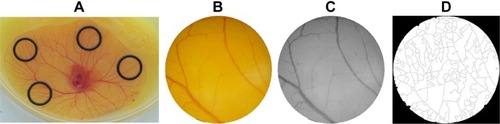
Figure 3 Characterization of peptide-coated AuNPs.
Notes: (A) Transmission electron micrograph of OEG AuNPs. (B) Normalized UV-vis spectra of OEG AuNPs and peptide–OEG AuNPs showing a slight red shift in the plasmon peak arising from a small change in the refractive index around the AuNP due to the peptide coating. Inset is magnifying the SPR peak.
Abbreviations: AuNPs, gold nanoparticles; OEG, oligo-ethylene glycol; SPR, surface plasmon resonance.
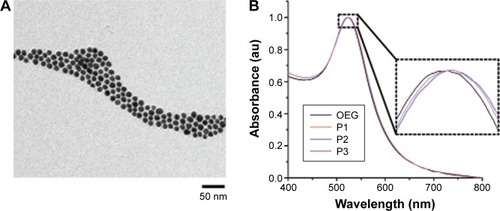
Figure 4 Angiogenesis on two independent CAMs after 24-hour exposure to: control.
Notes: (A) P1–AuNPs; (B) P2–AuNPs; (C) P3–AuNPs.
Abbreviations: AuNPs, gold nanoparticles; CAM, chorioallantoic membrane.
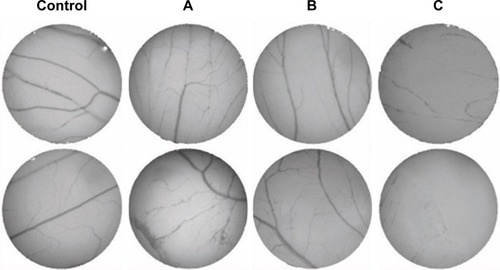
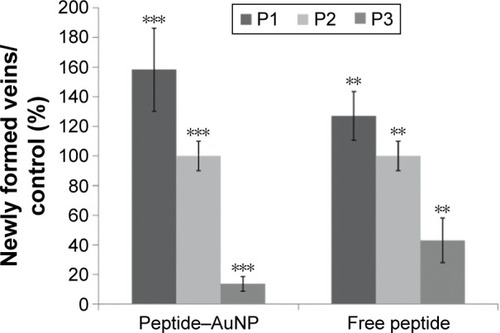
Table 1 Percentage of newly formed arterioles in CAMs exposed to free peptides (P1, P2, or P3) or the respective peptide–AuNP relative to control
Figure 5 Percentage of newly formed arterioles.
Notes: As a result of exposure to free peptide or AuNPs (peptide–AuNPs) relative to control (phosphate-buffered saline): P1, proangiogenic peptide; P2, scrambled peptide; P3, antiangiogenic peptide. The concentration of peptide was kept constant (0.01 pmol/μL). Error bars represent the standard deviation from the mean. A total of 46 eggs were analyzed. **P<0.005; ***P<0.0001.
Abbreviation: AuNPs, gold nanoparticles.