
Figures & data
Figure 1 Physical characterization of the nanostructures.
Notes: (A) UV–vis absorption spectra of gold nanoparticles (black spectrum) and Tween® 20-coated GNPs (red spectrum). The spectra are normalized to unity for better illustration. Inset: TEM image of gold nanoparticles. (B) Shows assigned values of nanoparticle hydrodynamic diameter determined by DLS, zeta potential, diameter determined by TEM, and LSPR band position. “–” indicates no data.
Abbreviations: GNPs, gold nanoparticles; TEM, transmission electron microscopy; DLS, dynamic light scattering; LSPR, localized surface plasmon resonance; au, arbitrary units; UV, ultra violet.
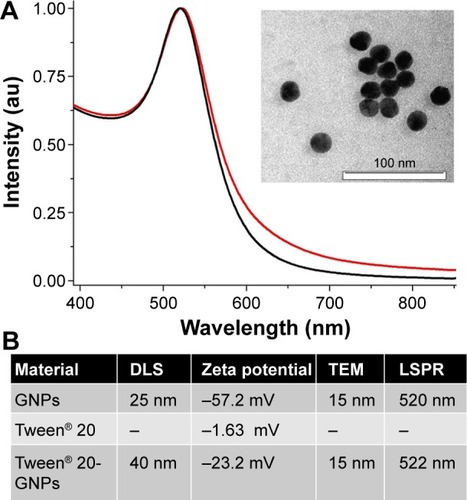
Table 1 The body weight evaluation for various doses of Tween® 20-GNPs at days 1–14
Table 2 Organ weight evaluation for Tween® 20-GNPs at days 1–14
Table 3 Complete blood count evaluation for different dosages at day 14
Figure 2 Organ weight evaluation for the acute toxicity experiments, for different nanoparticle concentrations.
Notes: Evaluation for the spleen (A), lung (B), liver (C), kidney (D), and heart (E).
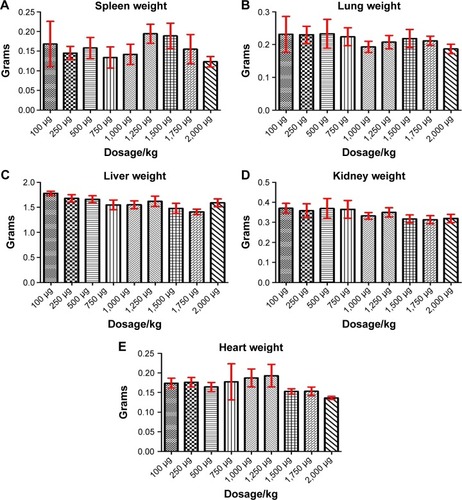
Figure 3 Hematological assessment at day 14.
Notes: WBC count (A), RBC count (B), neutrophil count (C), monocyte count (D), lymphocyte count (E), Hb value (F), and HCT value (G).
Abbreviations: WBC, white blood cell; RBC, red blood cell; Hb, hemoglobin; HCT, hematocrit.
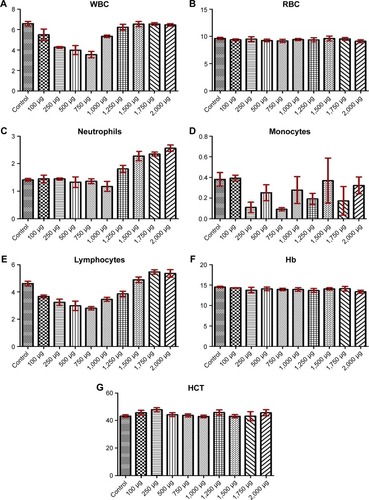
Figure 4 Pathology examination of the organs.
Notes: No acute toxicity of the Tween® 20-GNPs construct over the spleen (A), lung (B), liver (C), kidney (D), and heart (E). ×20 magnification.
Abbreviation: GNPs, gold nanoparticles.
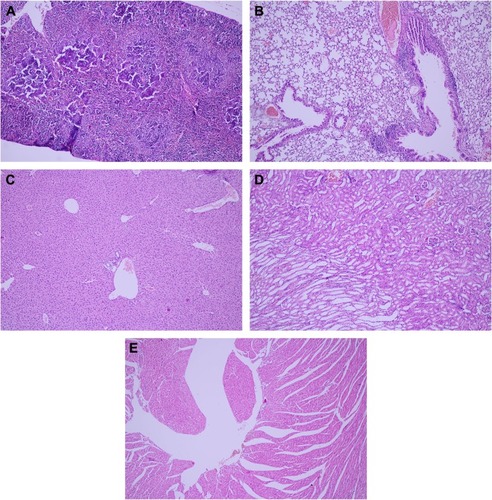
Table 4 Body weight of the experimental and control group
Table 5 Hematological assessment of the chronic toxicity study
Table 6 Reactive or increased magakaryocyte count for animals treated with GNP-Tween
Figure 5 Body weight evaluation throughout the period of sub-chronic administration of Tween® 20-GNPs.
Abbreviation: GNPs, gold nanoparticles.
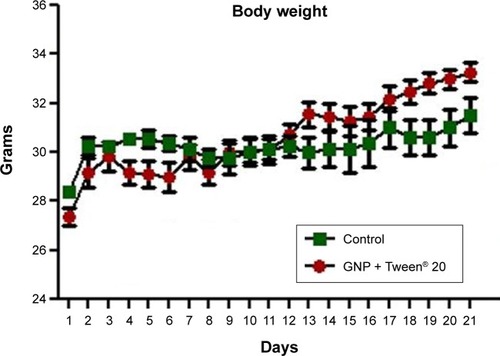
Figure 6 Pathology examination of the bone marrow.
Notes: Pathology examination of the bone marrow of the mice treated with Tween® 20-GNPs (A and B) and of the control group (C and D). In (A) and (C), ×4 magnification, and in (B) and (D), ×20 magnification. The black arrows show the megakaryocytes.
Abbreviation: GNPs, gold nanoparticles.
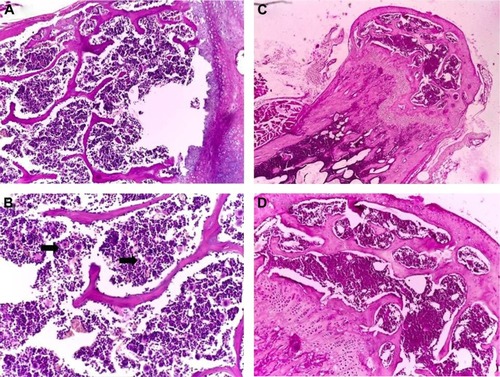
Figure 7 Increased megakaryopoiesis in the mice treated with Tween® 20-GNPs.
Note: Megakaryocyte count is shown.
Abbreviations: GNPs, gold nanoparticles; HPFs, high-power fields.
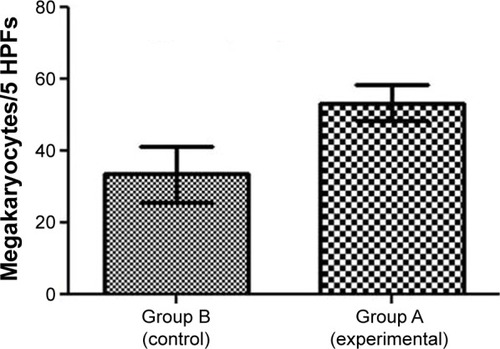
Table 7 Liver toxicity assessment
Figure 8 Interface hepatitis-like lesions and mild fibrosis in mice treated with Tween 20-GNPs.
Notes: Pathology images are shown. (A) HE stain, massive lymphoplasmacytic infiltrate in the liver tissue (star) with interface hepatitis-like lesions. (B) HE stain, binucleated (left arrow) and glycogenated (right arrow) nuclei. (C) Masson’s-Trichrome staining, mild liver fibrosis. (D) Gomori stain – normal liver architecture.
Abbreviations: GNPs, gold nanoparticles; HE, Hematoxylin-Eosin stain.
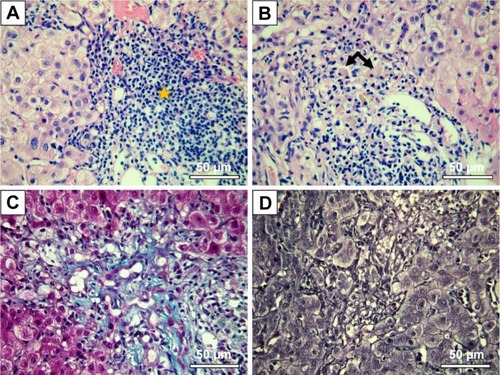
Table 8 Organ distribution of the gold nanoparticles