Figures & data
Figure 1 Schematic illustration of the overall concept of DC-based cancer immunotherapy.
Notes: PLGA-NPs can be efficiently taken up by DCs. After uptake of PLGA-NPs, the PLGA-NPs prompt DC maturation and activation followed by release of adjuvant and antigen from NPs. Finally, mature DCs cross-present the antigen to active CD8+ T cells, which then kill the tumor cells.
Abbreviations: DC, dendritic cell; NPs, nanoparticles; PLGA, poly(d,l-lactide-co-glycolide).
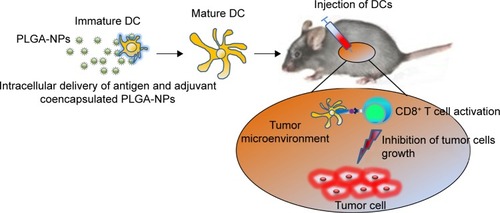
Figure 2 Physical properties of PLGA-NPs.
Notes: (A) Size and (B) zeta potential of PLGA-NPs were measured by light scattering with a particle size analyzer and Zeta Plus, respectively. (C) Histograms of various PLGA-NPs showing the size distribution and morphology of PLGA-NPs by scanning electron microscopy. Scale bar: 200 nm. (D) Loading efficiency of OVA and poly I:C into PLGA-NPs was determined by BCA protein assay. The data are presented as the mean ± SD (n=3).
Abbreviations: NPs, nanoparticles; OVA, ovalbumin; PLGA, poly(d,l-lactide-co-glycolide); poly I:C, polyinosinic-polycytidylic acid; SD, standard deviation.
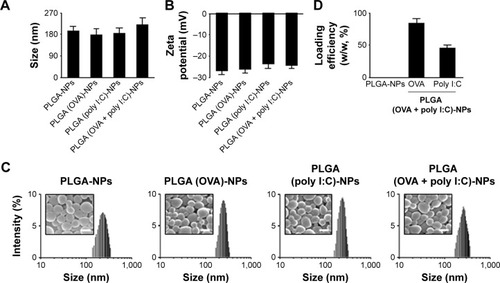
Figure 3 Intracellular uptake of PLGA-NPs in DCs.
Notes: (A) Intracellular delivery efficiency of PLGA-NPs was evaluated by flow cytometry. The cells were incubated with PLGA-NPs encapsulating TRITC-labeled OVA for 30 min at 37°C. (B) Fluorescence images were obtained by confocal microscopy. Red color shows TRITC-labeled OVA and green color shows the nuclei. Scale bar: 20 μm. *P-value (PLGA [OVA + poly I:C]-NPs) vs control. P<0.05.
Abbreviations: DCs, dendritic cells; NPs, nanoparticles; OVA, ovalbumin; PLGA, poly(d,l-lactide-co-glycolide); poly I:C, polyinosinic-polycytidylic acid; TRITC, tetra-methylrhodamine.
![Figure 3 Intracellular uptake of PLGA-NPs in DCs.Notes: (A) Intracellular delivery efficiency of PLGA-NPs was evaluated by flow cytometry. The cells were incubated with PLGA-NPs encapsulating TRITC-labeled OVA for 30 min at 37°C. (B) Fluorescence images were obtained by confocal microscopy. Red color shows TRITC-labeled OVA and green color shows the nuclei. Scale bar: 20 μm. *P-value (PLGA [OVA + poly I:C]-NPs) vs control. P<0.05.Abbreviations: DCs, dendritic cells; NPs, nanoparticles; OVA, ovalbumin; PLGA, poly(d,l-lactide-co-glycolide); poly I:C, polyinosinic-polycytidylic acid; TRITC, tetra-methylrhodamine.](/cms/asset/cb48e980-482a-427b-96d5-235f349fdca1/dijn_a_109001_f0003_c.jpg)
Figure 4 Viability of DCs after uptake of (A) PLGA-NPs and (B) PLGA (OVA + poly I:C)-NPs at different time periods (24 and 48 hr).
Notes: MTT assay was performed to determine cell viability following treatment with indicated concentrations of PLGA-NPs. The data are represented as mean ± SD (n=3).
Abbreviations: DCs, dendritic cells; MTT, 3-(4,5-dimethylthiazol-2-yl)-2,5-diphenyltetrazolium bromide; NPs, nanoparticles; OVA, ovalbumin; PLGA, poly(d,l-lactide-co-glycolide); poly I:C, polyinosinic-polycytidylic acid; SD, standard deviation.
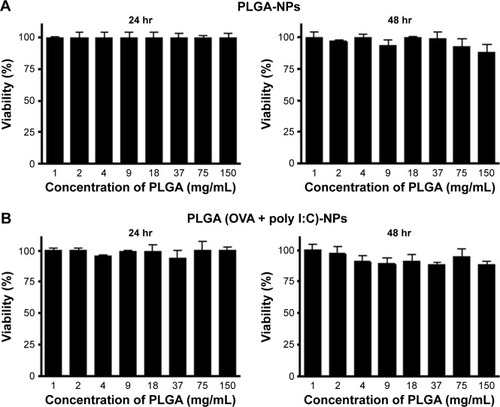
Figure 5 DC maturation and cytokine secretion from mature DCs induced by PLGA-NPs.
Notes: (A) To assess the maturation level of DCs after incubation with PLGA-NPs for 48 hr, maturation surface markers (CD40, CD80, CD86, MHC class I, MHC class II, and OVA-specific antibody) were confirmed by flow cytometric analysis (*P<0.001, **P<0.002). (B) DC activation was demonstrated by measuring proinflammatory cytokines and DC activation factors in the culture supernatant of DCs incubated with PLGA-NPs for 1 week with ELISA (*P<0.001, **P<0.002).
Abbreviations: DCs, dendritic cells; ELISA, enzyme-linked immunosorbent assay; IL, interleukin; MHC, major histocompatibility complex; MFI, mean fluorescence intensity; NPs, nanoparticles; OVA, ovalbumin; PLGA, poly(d,l-lactide-co-glycolide); poly I:C, polyinosinic-polycytidylic acid; TNF-α, tumor necrosis factor alpha.
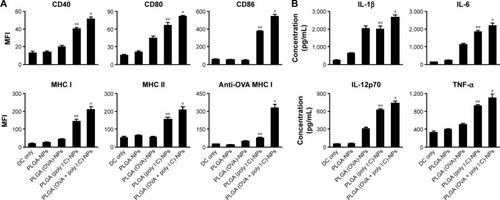
Figure 6 Vaccination with PLGA-NP-treated DCs generated an enhanced OVA-specific CD8+ T cell immune response in C57BL/6 mice (five per group).
Notes: (A) OVA-specific CD8+ T cell immune responses were assessed in splenocytes of vaccinated mice by flow cytometry. The bar graph depicts the number of IFN-γ+ and OVA-specific CD8+ T cells in the splenocytes. (B) In vivo CTL assay was performed to confirm CTL response. Splenocytes were isolated from DC-vaccinated mice. OVA-specific CD8+ T cells were analyzed by flow cytometry. Bar graph depicts the percentage of specifically killed cells. Data are mean ± SD (n=5) (*P<0.01).
Abbreviations: CFSE, carboxyfluorescein succinimidyl ester; CTL, cytotoxic T lymphocyte; DCs, dendritic cells; IFN-γ, interferon gamma; NPs, nanoparticles; OVA, ovalbumin; PLGA, poly(d,l-lactide-co-glycolide); poly I:C, polyinosinic-polycytidylic acid; SD, standard deviation.
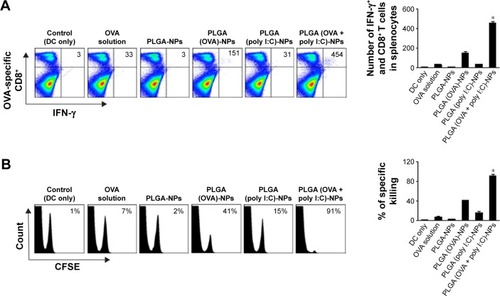
Figure 7 Antitumor efficacy of DCs treated with PLGA-NPs in the EG.7 tumor model.
Notes: Treatment was started 1 week after sc injection of tumor cells into mice. DCs only, DCs treated with OVA solution, DCs treated with PLGA-NPs, DCs treated with PLGA (OVA)-NPs, DCs treated with PLGA (poly I:C)-NPs, and DCs treated with PLGA (OVA + poly I:C)-NPs were administered three times weekly at a dose of 100 μg of OVA and 100 μg of poly I:C by sc injection. (A) Experimental schedule for DC-based tumor therapy. (B) Tumor volume after treatment with the various formulations. (C) Survival of mice. (D) Images of treated mice. (E) Immunohistochemistry for CD8 T cell localization (CD8 antibody, scale bar: 50 μm) and tumor cell apoptosis (procaspase 3 antibody, scale bar: 50 μm) were performed on EG.7-tumor tissues following vaccination with DCs. Error bars represent sem. *P-value (PLGA [OVA + poly I:C]-NPs) vs DC only. P<0.05.
Abbreviations: DCs, dendritic cells; NPs, nanoparticles; OVA, ovalbumin; PLGA, poly(d,l-lactide-co-glycolide); poly I:C, polyinosinic-polycytidylic acid; sc, subcutaneous; sem, standard error of mean; TUNEL, terminal deoxynucleotidyl transferase dUTP nick-end labeling.
![Figure 7 Antitumor efficacy of DCs treated with PLGA-NPs in the EG.7 tumor model.Notes: Treatment was started 1 week after sc injection of tumor cells into mice. DCs only, DCs treated with OVA solution, DCs treated with PLGA-NPs, DCs treated with PLGA (OVA)-NPs, DCs treated with PLGA (poly I:C)-NPs, and DCs treated with PLGA (OVA + poly I:C)-NPs were administered three times weekly at a dose of 100 μg of OVA and 100 μg of poly I:C by sc injection. (A) Experimental schedule for DC-based tumor therapy. (B) Tumor volume after treatment with the various formulations. (C) Survival of mice. (D) Images of treated mice. (E) Immunohistochemistry for CD8 T cell localization (CD8 antibody, scale bar: 50 μm) and tumor cell apoptosis (procaspase 3 antibody, scale bar: 50 μm) were performed on EG.7-tumor tissues following vaccination with DCs. Error bars represent sem. *P-value (PLGA [OVA + poly I:C]-NPs) vs DC only. P<0.05.Abbreviations: DCs, dendritic cells; NPs, nanoparticles; OVA, ovalbumin; PLGA, poly(d,l-lactide-co-glycolide); poly I:C, polyinosinic-polycytidylic acid; sc, subcutaneous; sem, standard error of mean; TUNEL, terminal deoxynucleotidyl transferase dUTP nick-end labeling.](/cms/asset/e4a735fe-853e-4547-a27d-c6666c46eb33/dijn_a_109001_f0007_c.jpg)
Figure 8 Antitumor efficacy of DCs treated with PLGA-NPs in the TC-1 tumor model.
Notes: Treatment was started 1 week after sc injection of tumor cells into mice. DCs only, DCs treated with E7 solution, DCs treated with PLGA-NPs, DCs treated with PLGA (E7)-NPs, DCs treated with PLGA (poly I:C)-NPs, and DCs treated with PLGA (E7 + poly I:C)-NPs were administered three times weekly at a dose of 100 μg of E7 and 100 μg of poly I:C by sc injection. (A) Experimental schedule for DC-based tumor therapy. (B) Tumor volume after treatment with the various formulations. (C) Survival of mice. (D) Images of treated mice. (E) Immunohistochemistry for CD8 T cell localization (CD8 antibody, scale bar: 50 μm) and tumor cell apoptosis (procaspase 3 antibody, scale bar: 50 μm) were performed on EG.7-tumor tissues following vaccination with DCs. Error bars represent sem. *P-value (PLGA [OVA + poly I:C]-NPs) vs DC only. P<0.05.
Abbreviations: DCs, dendritic cells; NPs, nanoparticles; OVA, ovalbumin; PLGA, poly(d,l-lactide-co-glycolide); poly I:C, polyinosinic-polycytidylic acid; sc, subcutaneous; sem, standard error of mean; TUNEL, terminal deoxynucleotidyl transferase dUTP nick-end labeling.
![Figure 8 Antitumor efficacy of DCs treated with PLGA-NPs in the TC-1 tumor model.Notes: Treatment was started 1 week after sc injection of tumor cells into mice. DCs only, DCs treated with E7 solution, DCs treated with PLGA-NPs, DCs treated with PLGA (E7)-NPs, DCs treated with PLGA (poly I:C)-NPs, and DCs treated with PLGA (E7 + poly I:C)-NPs were administered three times weekly at a dose of 100 μg of E7 and 100 μg of poly I:C by sc injection. (A) Experimental schedule for DC-based tumor therapy. (B) Tumor volume after treatment with the various formulations. (C) Survival of mice. (D) Images of treated mice. (E) Immunohistochemistry for CD8 T cell localization (CD8 antibody, scale bar: 50 μm) and tumor cell apoptosis (procaspase 3 antibody, scale bar: 50 μm) were performed on EG.7-tumor tissues following vaccination with DCs. Error bars represent sem. *P-value (PLGA [OVA + poly I:C]-NPs) vs DC only. P<0.05.Abbreviations: DCs, dendritic cells; NPs, nanoparticles; OVA, ovalbumin; PLGA, poly(d,l-lactide-co-glycolide); poly I:C, polyinosinic-polycytidylic acid; sc, subcutaneous; sem, standard error of mean; TUNEL, terminal deoxynucleotidyl transferase dUTP nick-end labeling.](/cms/asset/9c54b47f-33ad-4d9d-8e12-e894eae3cf1f/dijn_a_109001_f0008_c.jpg)
Figure 9 Antitumor efficacy of DCs treated with PLGA (OVA + poly)-NPs with CD8+ T cell depletion.
Notes: DCs were administered three times (sc, 2×10⁶ cells/mouse, 1 week intervals for 3 weeks) in the right flank. Depletions (100 μg of anti-CD8 antibody, once daily) were initiated 5 days after tumor cell injection and lasted until the end of the experimental period. (A) Experimental schedule for DC-based tumor therapy with CD8+ T cell depletion. (B) Tumor volume. (C) Images of treated mice. Error bars represent sem.
Abbreviations: DCs, dendritic cells; NPs, nanoparticles; OVA, ovalbumin; PLGA, poly(d,l-lactide-co-glycolide); poly I:C, polyinosinic-polycytidylic acid; sc, subcutaneous; sem, standard error of mean.
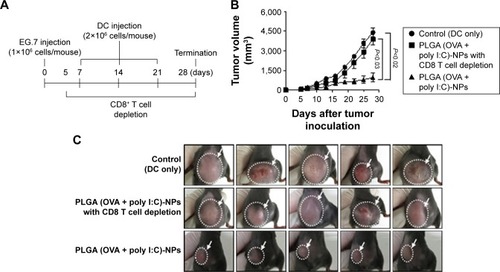
Figure S1 Release behavior of OVA from PLGA (OVA + poly I:C)-NP.
Note: The data are represented as mean ± SD (n=3).
Abbreviations: NPs, nanoparticles; OVA, ovalbumin; PLGA, poly(d,l-lactide-co-glycolide); poly I:C, polyinosinic-polycytidylic acid; SD, standard deviation.
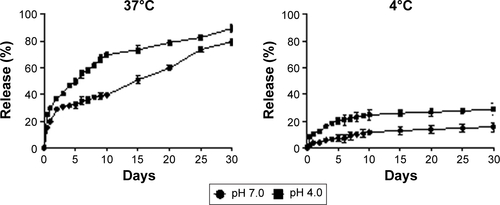
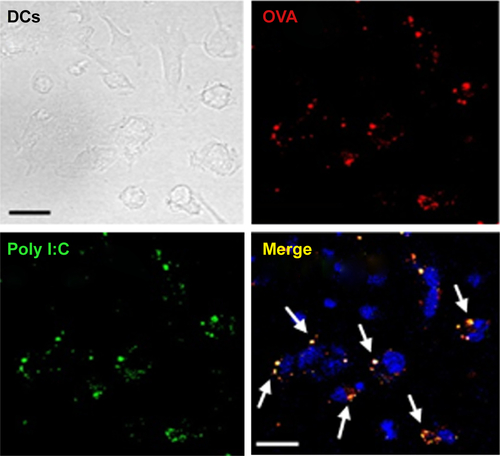
Figure S2 Intracellular delivery of PLGA (OVA + poly I:C)-NP in DCs. OVA was labeled with TRICT fluorescence and poly I:C labeled with FITC. Scale bar: 20 μm.
Abbreviations: DCs, dendritic cells; FITC, fluorescein isothiocyanate; NPs, nanoparticles; OVA, ovalbumin; PLGA, poly(d,l-lactide-co-glycolide); poly I:C, polyinosinic-polycytidylic acid; TRITC, Tetramethylrhodamine.