Figures & data
Table 1 Particle size distribution, drug loading, and encapsulation efficiency of eupafolin (Eup) and eupafolin nanoparticle delivery system (ENDS)
Figure 1 Particle size distribution (A) and transmission electron microscopy photograph (B) of eupafolin nanoparticle delivery system (ENDS).
Notes: The particle size distribution of ENDS was determined by an N5 submicrometer particle size analyzer. It can be seen that ENDS exhibited small particle sizes with uniform size distribution. Results are representative of three independent experiments.
Abbreviation: Rept, reception.
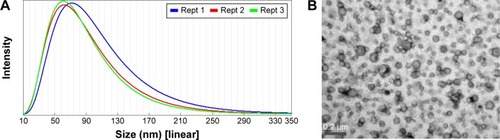
Figure 2 Physicochemical properties of ENDS compared to raw eupafolin.
Notes: (A) Proton nuclear magnetic resonance (1H NMR) spectra of raw eupafolin and eupafolin nanoparticle delivery system (ENDS). The 1H NMR spectra showed that the aromatic protons (H2′ and H8) of raw eupafolin were obviously shifted upfield and an hydroxyl group signal disappeared in the spectrum of ENDS, indicating the formation of an intermolecular hydrogen bond between eupafolin and excipient. (B) Fourier transform infrared (FTIR) spectra of raw eupafolin and ENDS. (C) Powder X-ray diffraction (XRD) patterns of raw eupafolin and ENDS. The characteristic diffraction peaks of raw eupafolin in the XRD pattern were greatly diminished in ENDS, indicating crystalline to amorphous transformation. Results are representative of three independent experiments.
Abbreviations: Eup, eupafolin; %T, % transmittance.
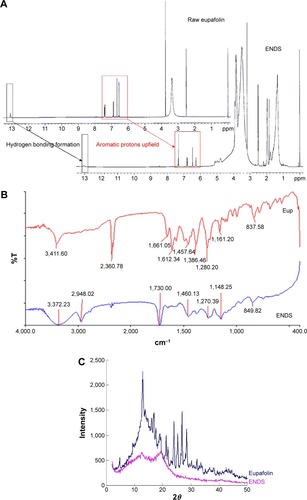
Figure 3 Schematic diagram of eupafolin nanoparticle delivery system (ENDS), demonstrating the molecular interactions between eupafolin (shown in blue) and the nanoparticle carrier Eudragit E100 (shown in black).
Note: The aqueous phase consists of polyvinyl alcohol (PVA).
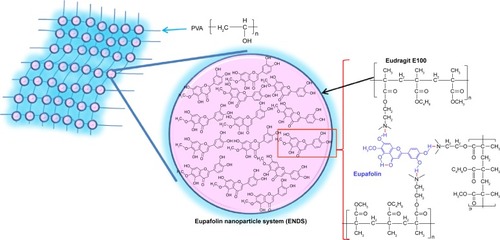
Figure 4 Water solubility and skin penetration of ENDS compared to raw eupafolin.
Notes: (A) The water solubility of raw eupafolin and eupafolin nanoparticle delivery system (ENDS), as determined by high-performance liquid chromatography (HPLC). The aqueous solubility of ENDS was effectively increased to 35-fold as compared to that of raw eupafolin. (B and C) The in vitro skin penetration of raw eupafolin and ENDS into the corneum layer (B) and epidermis and dermis (C) after 1 hour and 2 hours. In vitro skin penetration was determined using fresh pig skin from the flank region mounted on Franz diffusion cells. The results revealed that compared to raw eupafolin, ENDS showed higher content within the stratum corneum and greater penetration into the epidermis and dermis. Results are shown as mean ± SD. Data are from three independent experiments. *ENDS group is significantly different from eupafolin group (P<0.05).
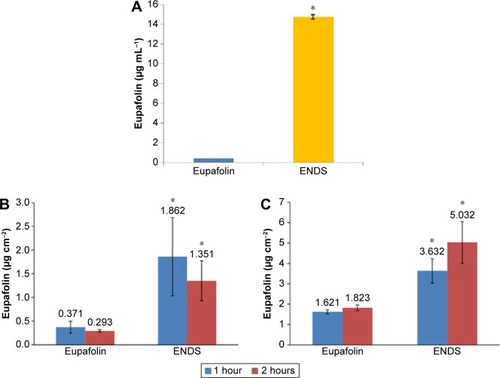
Figure 5 Effects of eupafolin nanoparticle delivery system (ENDS) on HaCaT keratinocyte cell viability.
Notes: (A) Treatment of HaCaT keratinocytes with various concentrations of ENDS for 24 hours had no significant effect on cell viability, as determined by the MTT assay. (B) Real-time cytotoxicity assay was performed using the xCELLigence Real-Time Cell Analyzer. Treatment of HaCaT keratinocytes with various concentrations of ENDS (10 μM, 40 μM, and 100 μM) for 0 hour to 72 hours had no significant effect on cell viability. (C) Cell viability was assessed by flow cytometry following propidium iodide and annexin V staining. Treatment of HaCaT keratinocytes with various concentrations of ENDS (40 μM and 100 μM) for 24 hours, 48 hours, and 72 hours had no significant effect on cell viability. Data are from three independent experiments.
Abbreviations: MTT, 3-(4,5-dimethylthiazol-2-yl)-2,5-diphenyltetrazolium bromide; CTL, control; FL1-A, fluorescence parameter 1-A; FL3-A, fluorescence parameter 3-A.
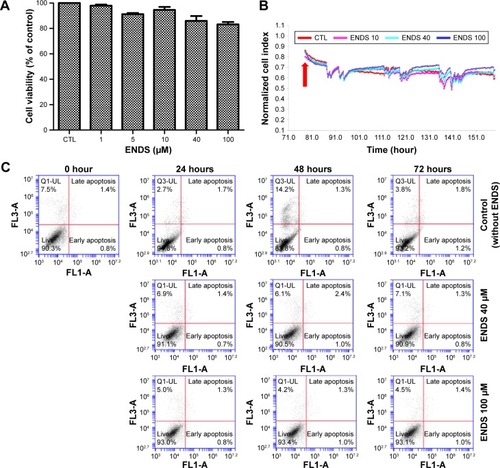
Figure 6 Effects of ENDS on ROS production and NADPH oxidase activity in HaCaT keratinocytes.
Notes: (A) Effects of raw eupafolin dissolved in PBS (EUPA-P), raw eupafolin dissolved in DMSO (EUPA-D), eupafolin nanoparticle delivery system (EUPA-N), and blank nanoparticle carriers (PVA-Eudragit E100) on PM-induced ROS production in HaCaT keratinocytes. Cells were pretreated with 10 μM EUPA-P, EUPA-D, EUPA-N, or blank PVA-Eudragit E100 for 1 hour and then treated with PM (50 μg cm−2) for 1 hour. Measurement of intracellular ROS concentration was performed using the fluorescent dichlorofluorescin diacetate (DCFH-DA) assay. (B) Effects of EUPA-P, EUPA-D, EUPA-N, and blank nanoparticle carriers (PVA-Eudragit E100) on PM-induced NADPH oxidase activity in HaCaT keratinocytes. NADPH oxidase activity was determined in cell membrane fractions by the lucigenin chemiluminescence assay. (C) Effects of EUPA-P and EUPA-N on PM-induced changes in NADP+/NADPH ratio in HaCaT cells, as determined by colorimetric NADP/NADPH assay. All data are expressed as mean ± SEM of three independent experiments. *PM-induced group is significantly different from control group (P<0.05). #Significant with respect to PM treatment alone (P<0.05).
Abbreviations: PBS, phosphate-buffered saline; DMSO, dimethyl sulfoxide; PM, particulate matter; ROS, reactive oxygen species; NADPH, nicotinamide adenine dinucleotide phosphate; SEM, standard error of the mean.
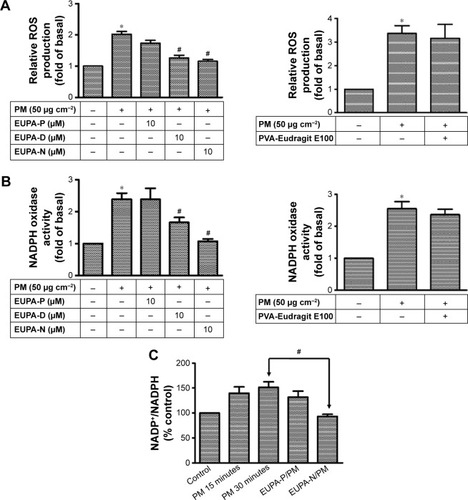
Figure 7 Effects of ENDS on COX-2 expression and PGE2 generation in keratinocytes.
Notes: (A) Effects of eupafolin dissolved in PBS (EUPA-P), eupafolin nanoparticle delivery system (EUPA-N), and eupafolin dissolved in DMSO (EUPA-D) on PM-induced COX-2 protein expression (as evaluated by Western blotting) in HaCaT keratinocytes. Cells were pretreated with EUPA-P, EUPA-D, or EUPA-N (0.1 μM, 1 μM, and 10 μM) for 1 hour and then treated with PM (50 μg cm−2) for 24 hours. (B) Effects of ENDS and blank nanoparticle carriers (PVA-Eudragit E100) on PM-induced COX-2 protein expression (as evaluated by Western blotting) in primary native human epidermal keratinocytes. (C and D) Effects of EUPA-P, EUPA-D, and EUPA-N on PM-induced COX-2 mRNA expression (determined by RT-PCR) and PM-induced COX-2 gene transcription (determined by the luciferase activity assay) in HaCaT keratinocytes. Cells were pretreated with EUPA-P, EUPA-D, or EUPA-N for 1 hour and then treated with PM for 6 hours. (E) Transfection of cells with siRNA-p47phox and siRNA-gp91phox resulted in adequate inhibition of p47phox and gp91phox protein expression (as evaluated by Western blotting), respectively. In particular, knockdown of NOX2 expression by siRNA-p47phox or siRNA-gp91phox suppressed PM-induced COX-2 protein expression in HaCaT cells, while transfection with control scrambled siRNA had no significant effect. (F) Flow cytometric assessment of cell surface NOX2 expression in HaCaT keratinocytes. Treatment of cells with PM alone induced an increase in NOX2 expression. Transfection of cells with siRNA-gp91phox suppressed PM-induced NOX2 expression, while transfection with scrambled siRNA had no significant effect. All four samples in (F) were stained with anti-NOX2/gp91phox antibody. (G) Effects of EUPA-N, EUPA-P, and blank nanoparticle carriers (PVA-Eudragit E100) on PM-induced phospho-p47 levels in HaCaT cell membrane fractions (determined by Western blotting). (H) Effects of EUPA-P, EUPA-D, EUPA-N, si-NOX2 (si-gp91phox), and si-p47phox on PM-induced PGE2 generation (determined by the PGE2 enzyme immunoassay) in HaCaT keratinocytes. Cells were pretreated with EUPA-P, EUPA-D, or EUPA-N for 1 hour and then treated with PM for 24 hours. Results are shown as mean ± SEM. Data are from three independent experiments. *Group is significantly different from PM treatment alone (P<0.05).
Abbreviations: PBS, phosphate-buffered saline; DMSO, dimethyl sulfoxide; COX-2, cyclooxygenase-2; PM, particulate matter; RT-PCR, reverse transcription-polymerase chain reaction; PGE2, prostaglandin E2; NADPH, nicotinamide adenine dinucleotide phosphate; SEM, standard error of the mean; ENDS, eupafolin nanoparticle delivery system; CTL, control.
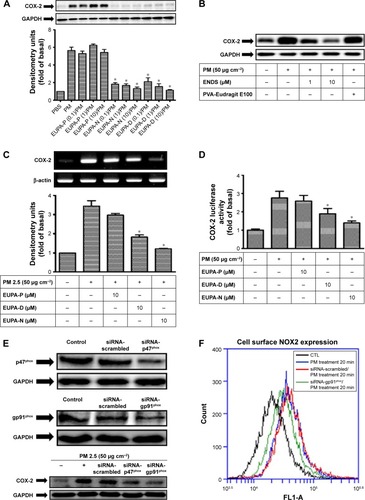
Figure 8 Eupafolin nanoparticle delivery system (ENDS) inhibited the activation of MAPKs in PM-stimulated HaCaT keratinocytes.
Notes: (A–C) Effects of specific NADPH oxidase inhibitor apocynin (APO, 100 μM), antioxidant N-acetylcysteine (NAC, 100 μM), specific MAPK inhibitors (10 μM U0126, SB202190, and SP600125), ENDS (10 μM), and raw eupafolin (10 μM) on the phosphorylation status of (A) ERK, (B) p38, and (C) JNK in HaCaT keratinocytes stimulated with PM (50 μg cm−2) for 4 hours, as determined by Western blotting. All Western blot samples were performed in one gel. Results are shown as mean ± SEM. *Group is significantly different with respect to PM treatment alone (P<0.05). (D) Effects of eupafolin in PBS (EUPA-P), eupafolin in DMSO (EUPA-D), and eupafolin nanoparticle delivery system (EUPA-N) on PM-induced c-Fos and P65 phosphorylation in HaCaT keratinocytes (as evaluated by Western blotting). All Western blots are from three independent experiments.
Abbreviations: MAPK, mitogen-activated protein kinase; PM, particulate matter; NADPH, nicotinamide adenine dinucleotide phosphate; PBS, phosphate-buffered saline; DMSO, dimethyl sulfoxide; CTL, control; SEM, standard error of the mean.
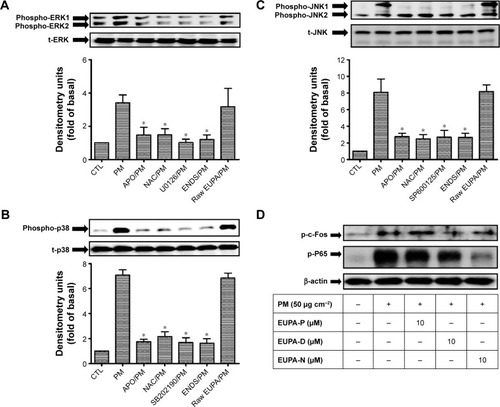
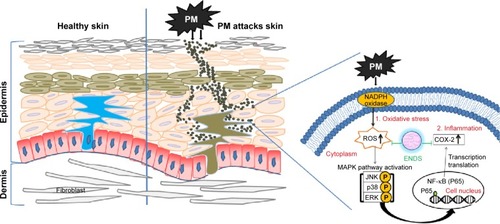
Figure 9 Schematic diagram showing the molecular mechanisms through which eupafolin nanoparticle delivery system (ENDS) inhibited PM-induced oxidative stress and inflammation in the skin.
Abbreviations: MAPK, mitogen-activated protein kinase; NADPH, nicotinamide adenine dinucleotide phosphate; PM, particulate matter; COX-2, cyclooxygenase-2; ROS, reactive oxygen species; NF-κB, nuclear factor-κB.