Figures & data
Figure 1 The transdermal delivery system of TMC NPs combined with electret.
Abbreviations: TMC, N-trimethyl chitosan; NPs, nanoparticles.
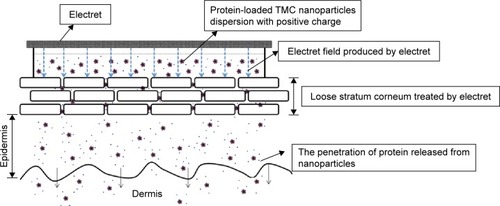
Figure 2 Normalized surface potential (Vs/V0) of +2,000 V electret before and after in vitro experiments.
Notes: Before: the normalized surface potential before in vitro experiments; After: the normalized surface potential after in vitro experiments. Data are expressed as mean ± SD (n=6).
Abbreviations: SD, standard deviation; ns, not significant.
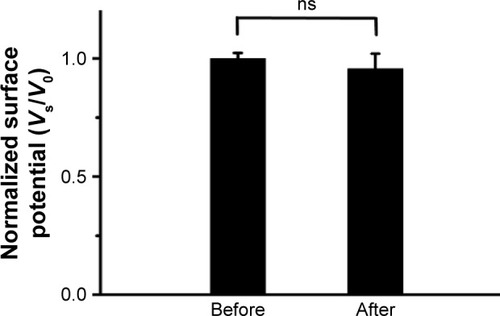
Figure 3 The 1H NMR spectra of synthesized TMC.
Note: The typical peak of the N-trimethyl group (–N+ (CH3)3) in the TMC chain was observed at 5.86 ppm (indicated by a black arrow).
Abbreviations: TMC, N-trimethyl chitosan; 1H NMR, 1Hydrogen nuclear magnetic resonance spectroscopy.
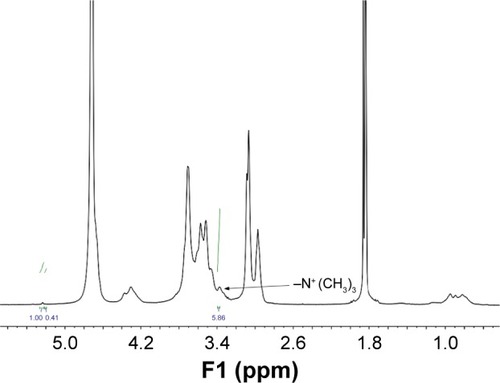
Table 1 The influence of TMC concentration and the weight ratio of TMC/TPP on the mean particle size (nm) of TMC NPs at a range of pH values
Figure 4 The (A) shows the TEM image of TMC NPs, and (B) shows the hydrodynamic size distribution of TMC NPs in aqueous solution.
Note: Bar represents 200 nm.
Abbreviations: TEM, transmission electron microscopy; TMC, N-trimethyl chitosan; NPs, nanoparticles.
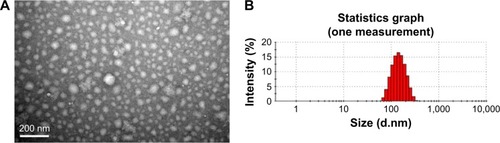
Figure 5 In vitro skin permeation assays of (A) FITC-BSA and (B) SOD across the rat skin at different time points up to 24 h.
Notes: The skin permeation amount expressed as cumulative amount (μg/cm2) of FITC-BSA or SOD in the skin was analyzed by spectrofluorophotometry or ELISA, respectively. “+ Et” means “combined with +2,000 V electret”. Data are expressed as mean ± SD (n=6). *P<0.05; **P<0.01.
Abbreviations: FITC, fluorescein isothiocyanate; BSA, bovine serum albumin; SOD, superoxide dismutase; ELISA, enzyme-linked immunosorbent assay; Et, electret; SD, standard deviation; TMC, N-trimethyl chitosan; NPs, nanoparticles; h, hours.
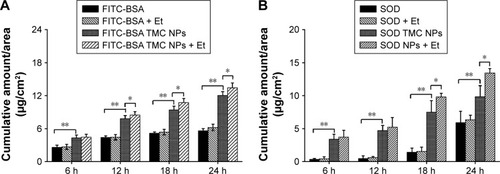
Figure 6 The quantitative analysis of (A) FITC-BSA and (B) SOD in different layers of the skin (the SC or the epidermis and dermis) after 24 h in the in vitro skin permeation assays.
Notes: The skin permeation amount expressed as cumulative amount (μg/cm2) of FITC-BSA or SOD in the skin was analyzed by spectrofluorophotometry or ELISA, respectively. “+ Et” means “combined with +2,000 V electret”. Data are expressed as mean ± SD (n=6). *P<0.05; **P<0.01.
Abbreviations: FITC, fluorescein isothiocyanate; BSA, bovine serum albumin; SOD, superoxide dismutase; SC, stratum corneum; ELISA, enzyme-linked immunosorbent assay; Et, electret; SD, standard deviation; ED, epidermis; D, dermis; TMC, N-trimethyl chitosan; NPs, nanoparticles.
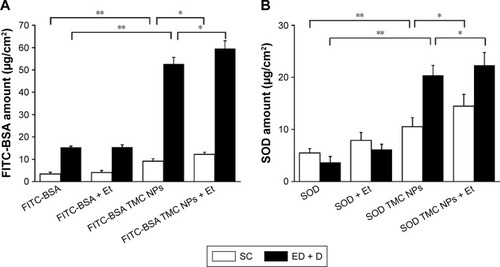
Figure 7 The effect of surface voltage and the sign of the corona voltage of electrets in the in vitro skin permeation assays of FITC-BSA TMC NPs at 12 or 24 h.
Notes: The skin permeation amount expressed as cumulative amount (μg/cm2) of FITC-BSA in the skin was analyzed by spectrofluorophotometry. Data are expressed as mean ± SD (n=6). *P<0.05.
Abbreviations: FITC, fluorescein isothiocyanate; BSA, bovine serum albumin; TMC, N-trimethyl chitosan; NPs, nanoparticles; SD, standard deviation.
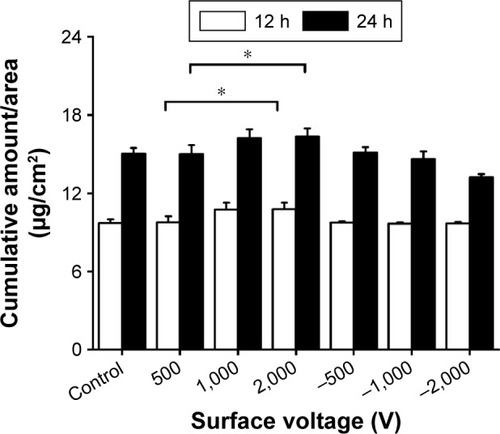
Figure 8 Quantitative analysis of FITC-TMC NPs in the (A) receptor compartment (*P<0.05; FITC-TMC NPs vs FITC-TMC NPs + Et) and (B) different layers of the skin (the SC or the epidermis and dermis) after 24 h in the in vitro skin permeation assays.
Notes: “+ Et” means “combined with +2,000 V electret”. Data are expressed as mean ± SD (n=6).
Abbreviations: FITC, fluorescein isothiocyanate; TMC, N-trimethyl chitosan; NPs, nanoparticles; Et, electret; SC, stratum corneum; SD, standard deviation; ED, epidermis; D, dermis.
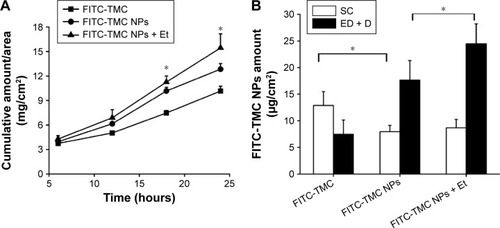
Table 2 The quantitative analysis of the relative fluorescence intensity of the skin after in vitro skin penetration assays analyzed by using the NIH ImageJ software
Figure 9 Confocal microscopic studies.
Notes: The representative fluorescent images show the permeation and distribution of (A) FITC-BSA and (B) FITC-TMC NPs in the in vitro skin permeation assays at 24 h. Bars represent 500 μm.
Abbreviations: FITC, fluorescein isothiocyanate; BSA, bovine serum albumin; TMC, N-trimethyl chitosan; NPs, nanoparticles; Et, electret; SC, stratum corneum.
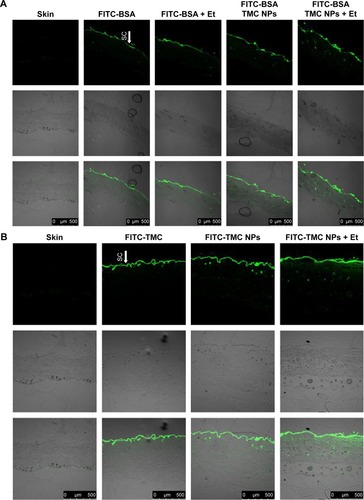
Figure 10 The histological examinations of the skin when treated by +2,000 V electret for different periods of time (untreated, 4, 8 and 12 h).
Notes: The skin was stained by H&E staining. Bars represent 50 μm.
Abbreviations: H&E, hematoxylin and eosin; h, hours.
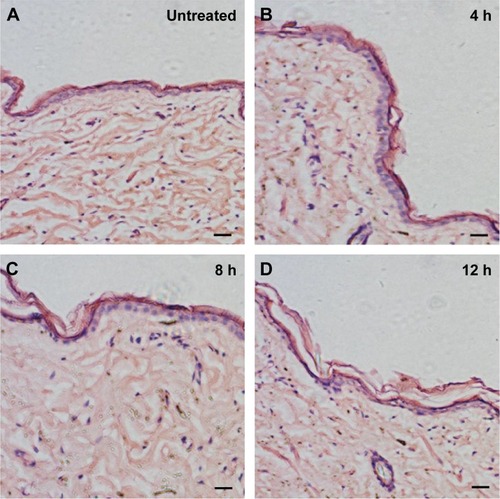
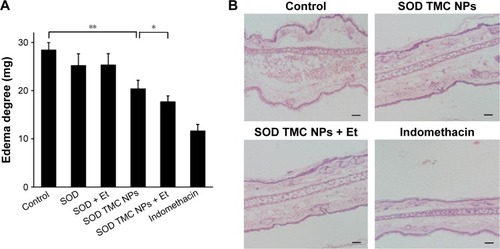
Figure 11 Anti-inflammatory assays in mice.
Notes: (A) The effect of different formulations on xylene-induced edema in the ear of BALB/c mice. Six hours after transdermal delivery of different drugs (indomethacin was used as a positive control), the edema in the ear of mice was induced by oxylene. Half an hour after oxylene administration, the edema degree of the ear in mice was calculated by subtracting the weight of the left ear from the weight of the right ear. Data are expressed as mean ± SD (n=6). (B) The H&E staining of the ear in mice in (A). Bars represent 50 μm. *P<0.05; **P<0.01.
Abbreviations: SD, standard deviation; H&E, hematoxylin and eosin; SOD, superoxide dismutase; TMC, N-trimethyl chitosan; NPs, nanoparticles.