Figures & data
Figure 1 Synthetic route of Se@PEI@siRNA.
Abbreviations: PEI, polyethylenimine; SeNPs, selenium nanoparticles; Se@PEI@ siRNA, small interfering RNAs with PEI-modified selenium nanoparticles; VC, vitamin C.
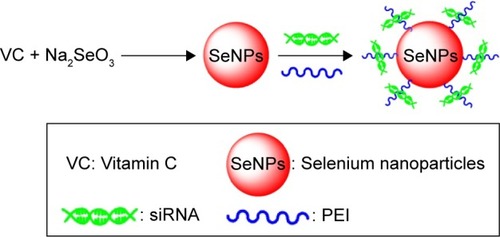
Figure 2 Characterization of Se@PEI@siRNA.
Notes: (A) TEM images of SeNPs, Se@PEI, and Se@PEI@siRNA, scale bar 200 nm. (B) Zeta potentials of SeNPs, Se@PEI, and Se@PEI@siRNA. (C) Size distribution of SeNPs, Se@PEI, and Se@PEI@siRNA. (D) Agarose gel retardation assay of Se@PEI/siRNA complexes at various ratios. Naked siRNA was used as control. (E) Stability of Se@PEI@siRNA in 10% fetal bovine serum. (F) In vitro release profiles of siRNA from Se@PEI@siRNA at pH 7.4 and 5.3. Bars with different characters are statistically different at P<0.05 (*) level.
Abbreviations: SeNP, selenium nanoparticle; Se@PEI@siRNA, small interfering RNAs with polyethylenimine-modified SeNPs; TEM, transmission electron microscope.
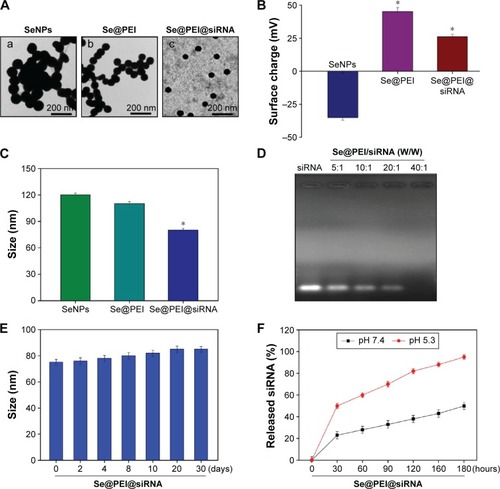
Figure 3 Effects of Se@PEI@siRNA on the growth of HepG2 cells as examined by MTT assay.
Notes: (A) HSP70 expression in HepG2 and LO2 cells. Western blotting was applied to determine the expression level of HSP70. (B–D) Antitumor activity of Se@PEI@ siRNA on HepG2 cells and normal cells was measured by MTT assay. (E) Morphological changes in HepG2 cells observed by phase-contrast microscopy (magnification, ×40). Bars with different characters are statistically different at P<0.05 (*) or P<0.01 (**) level.
Abbreviations: HSP, heat shock protein; LO2, normal human liver cell line; MTT, thiazolyl blue tetrazolium bromide; SeNP, selenium nanoparticle; Se@PEI@siRNA, small interfering RNAs with polyethylenimine-modified SeNPs.
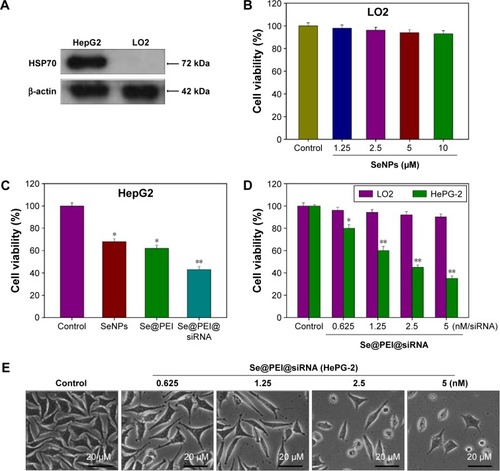
Figure 4 Localization and uptake pathways of coumarin-6-loaded Se@PEI@siRNA in HepG2 cells.
Notes: (A) The cells were treated with coumarin-6-loaded Se@PEI@siRNA for different periods of time and were observed under a fluorescent microscope stained with LysoTracker (red fluorescence, lysosome) and DAPI (blue fluorescence, nucleus) (magnification, ×100). (B) Intracellular uptake of Se@PEI@siRNA in HepG2 cells with different endocytosis-inhibited conditions. Significant difference between treatment and control group is indicated at P<0.01 (**) level.
Abbreviations: DAPI, 4′,6′-diamidino-2-phenyindole; DOG, 2-deoxyglucose; Se@PEI@siRNA, small interfering RNAs with polyethylenimine-modified selenium nanoparticles; min, minutes.
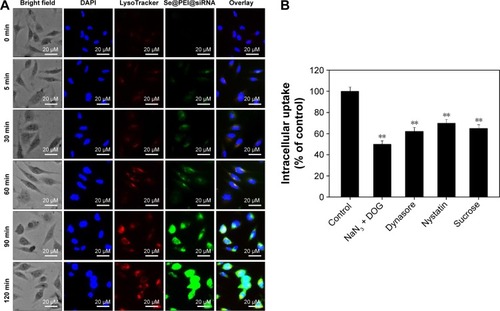
Figure 5 Se@PEI@siRNA-induced apoptosis in HepG2 cells.
Notes: (A) The cell cycle distribution after different treatments was analyzed by quantifying DNA content using flow cytometry analysis. (B) Representative photomicrographs of DNA fragmentation and nuclear condensation as detected by TUNEL-DAPI costaining assay. All results were representative of three independent experiments (magnification, ×100).
Abbreviations: DAPI, 4′,6′-diamidino-2-phenyindole; Se@PEI@siRNA, small interfering RNAs with polyethylenimine-modified selenium nanoparticles; TUNEL, terminal transferase dUTP nick end labeling.
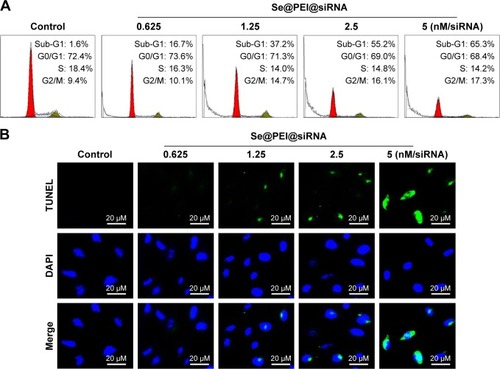
Figure 6 Induction of PARP cleavage and caspase-3 activity by Se@PEI@siRNA in HepG2 cells.
Notes: (A) Cells were treated with Se@PEI@siRNA for 24 hours, and caspase-3 activity was measured using synthetic fluorogenic substrate. (B) The expression of PARP and caspase-3 by Western blot; β-actin was used as loading control. Bars with different characters are statistically different at P<0.05 (*) or P<0.01 (**) level.
Abbreviations: PARP, poly (ADP-ribose) polymerase; Se@PEI@siRNA, small interfering RNAs with polyethylenimine-modified selenium nanoparticles.
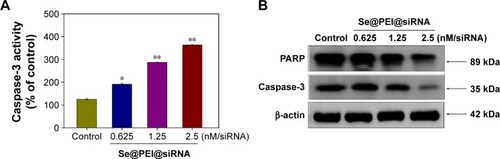
Figure 7 Suppression of HSP70 mRNA and protein expression in HepG2 cells among Se@PEI@scramble siRNA, Se@PEI@siRNA, and Lipofectamine 2000@siRNA.
Notes: (A) Suppression of HSP70 mRNA levels was quantified by Q-PCR. (B) The expression of HSP70 was evaluated by Western blot. Bars with different characters are statistically different at P<0.05 (*) or P<0.01 (**) level.
Abbreviations: HSP, heat shock protein; mRNA, messenger RNA; Q-PCR, quantitative polymerase chain reaction; Se@PEI@siRNA, small interfering RNAs with polyethylenimine-modified selenium nanoparticles.
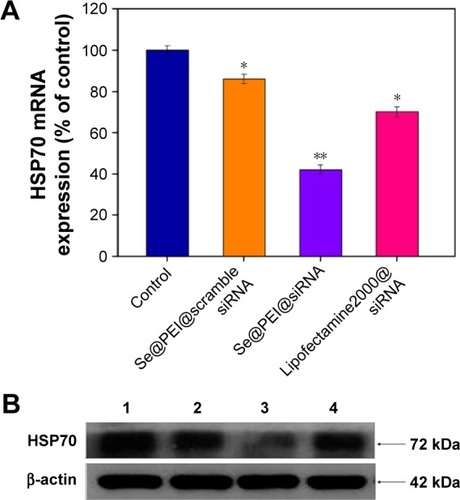
Figure 8 ROS overproduction induced by Se@PEI@siRNA in HepG2 cells.
Notes: (A) Changes of intracellular ROS generation. ROS levels were detected by DCF fluorescence intensity. (B) HepG2 cells were preincubated with 10 μM DCF for 30 minutes and then treated with Se@PEI@siRNA (magnification, ×100). Bars with different characters are statistically different at P<0.05 (*) or P<0.01 (**) level.
Abbreviations: DCF, dichlorofluorescein; ROS, reactive oxygen species; Se@PEI@siRNA, small interfering RNAs with polyethylenimine-modified selenium nanoparticles.
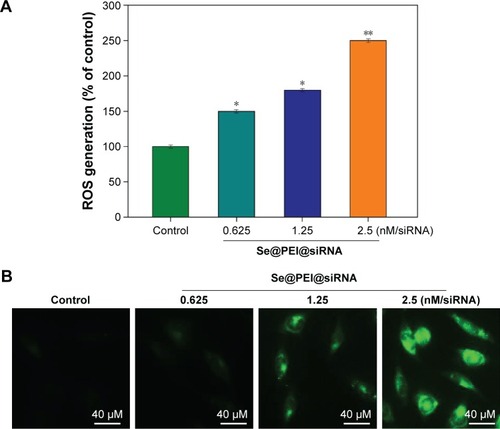
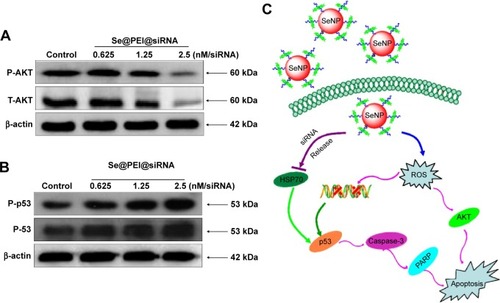
Figure 9 Activation of intracellular apoptotic signaling pathways by Se@PEI@siRNA in HepG2 cells.
Notes: (A) Phosphorylation status expression levels of AKT pathways. (B) Activation of p53 signaling pathway. (C) The main signaling pathway of apoptosis induced by Se@PEI@siRNA.
Abbreviations: HSP, heat shock protein; PARP, poly (ADP-ribose) polymerase; ROS, reactive oxygen species; SeNP, selenium nanoparticle; Se@PEI@siRNA, small interfering RNAs with polyethylenimine-modified selenium nanoparticles.