Figures & data
Table 1 Characterization of PS-encapsulated cubosome nanoparticles
Figure 1 Particle size and SAXS studies.
Notes: (A) The particle size of Cub and Cub-PS; (B) SAXS patterns of Cub and Cub-PS.
Abbreviations: Cub, cubosomes; Cub-PS, cubosome-polysaccharide nanoparticles; SAXS, small-angle X-ray scattering.
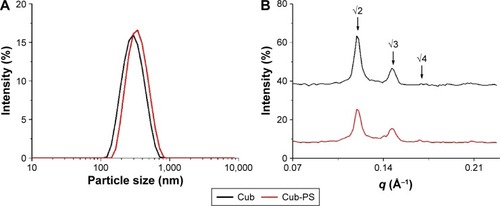
Figure 2 Cryo-FESEM micrographs of Cub and Cub-PS.
Abbreviations: Cub-PS, cubosome-polysaccharide nanoparticles; cryo-FESEM, cryo-field emission scanning electron microscopy.
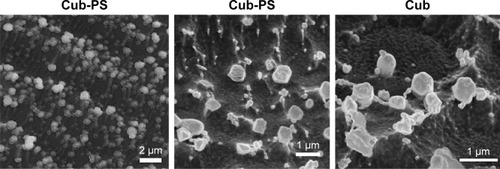
Figure 3 Cell viability of macrophages and change in CD4+ to CD8+ T-cell ratio.
Notes: (A) Cell viability of macrophages incubated in the presence of blank Cub and PS-containing cubosome dispersions (Cub-PS) and PS after 24 hours of incubation. (B) The ratio of CD4+ to CD8+ T-cells increased markedly after total spleen cells were incubated for 48 hours. Data are expressed as the mean ± SEM. *P<0.05 vs the PS group, while #P<0.05 vs the Cub group.
Abbreviations: Cub, cubosomes; Cub-PS, cubosome-polysaccharide nanoparticles; PS, polysaccharides; SEM, standard error of the mean.
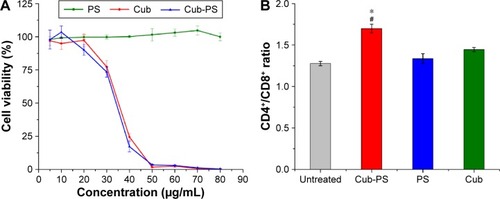
Figure 4 Cub-PS eliciting strong antigen-specific antibody and antibody subclass responses in vivo.
Notes: (A) Antigen-specific IgG levels in the serum on injection of different contents of Cub-PS after first immunization. (B) Antigen-specific IgG levels in the serum at the indicated time points after first immunization. (C) IgG1 and IgG2a levels in the serum of immunized mice 21 days after the first immunization. (D) IgG2b and IgG3 levels in the serum of immunized mice 21 days after the first immunization. Data are expressed as the mean ± SEM. *P<0.05 and **P<0.01 vs the PS-Ag group; #P<0.05 and ##P<0.01 vs the Cub-Ag group.
Abbreviations: Ag, antigen; Cub-Ag, mixture of cubosomes and Ag; Cub-PS-Ag, mixture of cubosome-polysaccharide nanoparticles and Ag; Ig, immunoglobulin; OD, optical density; PS-Ag, mixture of PS and Ag; SEM, standard error of the mean.
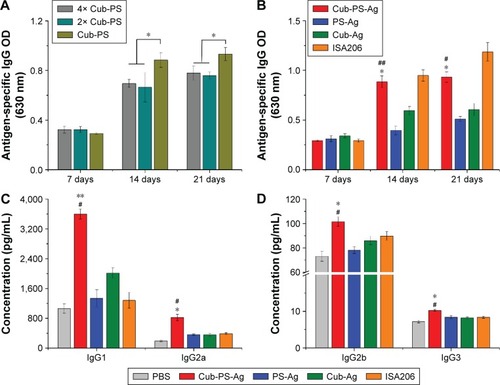
Figure 5 Production of cytokines in the serum of BALB/c mice.
Notes: (A) IL-4, (B) IL-12, (C) IFN-γ, (D) TNF-α, and (E) IL-17 at the indicated time points after first immunization were measured by ELISA. Data are expressed as the mean ± SEM. *P<0.05 and **P<0.01 vs the PS-Ag group, while #P<0.05 vs Cub-Ag group.
Abbreviations: Ag, antigen; Cub-Ag, mixture of cubosomes and Ag; Cub-PS-Ag, mixture of cubosome-polysaccharide nanoparticles and Ag; ELISA, enzyme-linked immunosorbent assay; IFN, interferon; IL, interleukin; PBS, phosphate-buffered saline; PS-Ag, mixture of PS and Ag; TNF, tumor necrosis factor; SEM, standard error of the mean.
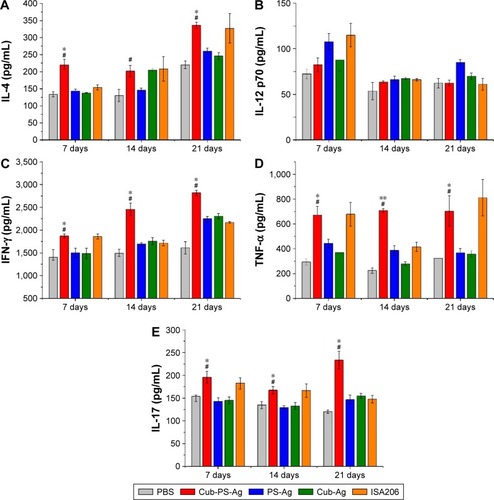
Figure 6 Cub-PS activating DCs in the draining lymph nodes in vivo.
Notes: Percentage of CD11c+MHC II+ and CD11c+CD86+cells in a total of 20,000 lymphocytes from naive mice or mice vaccinated with PS-Ag, Cub-Ag, Cub-PS-Ag, and ISA206 at (A) 24 hours and (B) 48 hours after subcutaneous injection. FACS plots in (C) are representative of the mean percentages of three mice in each group. Data are expressed as the mean ± SEM. *P<0.05 and **P<0.01 vs the PS-Ag group, while #P<0.05 vs Cub-Ag group.
Abbreviations: Ag, antigen; CD, cluster of differentiation; Cub-Ag, mixture of cubosomes and Ag; Cub-PS-Ag, mixture of cubosome-polysaccharide nanoparticles and Ag; DC, dendritic cells; FACS, fluorescence-activated cell sorting; LN, lymph node; MHC, major histocompatibility complex; PBS, phosphate-buffered saline; PS-Ag, mixture of PS and Ag; SEM, standard error of the mean.
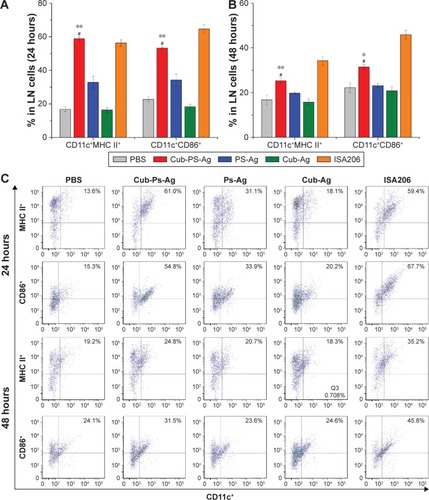
Figure 7 Available antigens in draining lymph nodes.
Notes: BALB/c mice were subcutaneously injected with PS-Ag, Cub-Ag, Cub-PS-Ag, and ISA206. Yellow areas indicated by arrows represent antigen.
Abbreviations: Ag, antigen; Cub-Ag, mixture of cubosomes and Ag; Cub-PS-Ag, mixture of cubosome-polysaccharide nanoparticles and Ag; PS-Ag, mixture of PS and Ag.
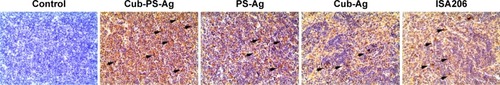
Figure 8 Frequency of central (CD62L+CCR7+)/effector (CD62L−CCR7−) memory CD4+CD44+ T-cells.
Notes: Mice were immunized with PS-Ag, Cub-Ag, Cub-PS-Ag, and ISA206. FACS plots in (A) are representative of the mean percentages of three mice in each group. The frequency of (B) CD4+CD44+CD62L+CCR7+ T-cells (TCM) and CD4+CD44+CD62L−CCR7− T-cells (TEM) were measured by flow cytometry. Data are expressed as the mean ± SEM. *P<0.05 and **P<0.01 vs the PS-Ag group, while #P<0.05 and ##P<0.01 vs Cub-Ag group.
Abbreviations: Ag, antigen; CCR, C-C motif chemokine receptor; CD, cluster of differentiation; Cub-Ag, mixture of cubosomes and Ag; Cub-PS-Ag, mixture of cubosome-polysaccharide nanoparticles and Ag; FACS, fluorescence-activated cell sorting; PBS, phosphate-buffered saline; PS-Ag, mixture of PS and Ag; TEM, effector memory T-cells; TCM, central memory T-cells; SEM, standard error of the mean.
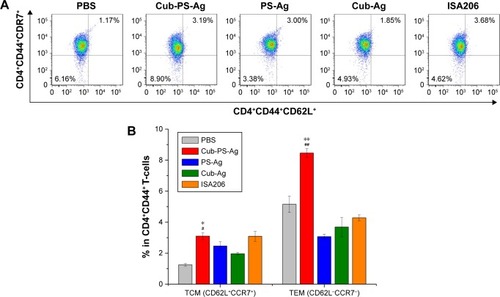
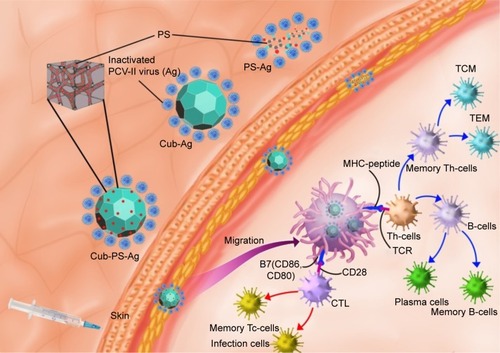
Figure 9 The possible mechanism of Cub-PS action as vaccine adjuvants.
Notes: Cub-PS was mixed with inactivated PCV-II viruses and the Cub-PS-Ag formulation is formed. After subcutaneous injection of Cub-PS-Ag formulation, APCs, especially DCs located in the subcutaneous region, can phagocytose the Cub-PS-Ag, process the antigens during the migration to secondary lymph nodes, and become mature. At this moment, DCs present the MHC–peptide complex to T-cells at lymph nodes. CD80 and CD86 are highly expressed on the surface of DCs. Subsequently, some of the T- and B-cells become memory cells and protect the organism upon a second encounter with the same pathogen.
Abbreviations: Ag, antigen; CTL, cytotoxic T-lymphocyte; Cub-Ag, mixture of cubosomes and Ag; Cub-PS-Ag, mixture of cubosome-polysaccharide nanoparticles and Ag; DC, dendritic cell; MHC, major histocompatibility complex; PCV, porcine circovirus; PS-Ag, mixture of PS and Ag; TCM, central memory T-cells; TCR, T-cell receptor; TEM, effector memory T-cells; Th-cells, T-helper cells; Tc-cells, cytotoxic T cells.