Figures & data
Figure 1 Raw materials, suspensions, and porous scaffolds.
Notes: (A) Optical and SEM micrographs of raw materials. (B) Optical micrographs of composite powder/NMP suspensions (left, 0 hour after sonication; right, 72 hours of storage after sonication). (C) Optical micrographs of porous scaffolds. S1, PEEK–10 wt% nano-HAP; S2, PEEK–10 wt% nano-HAP–1 wt% GNSs; S3, PEEK–10 wt% nano-HAP–0.8 wt% GNSs–0.2 wt% CNTs; S4, PEEK–10 wt% nano-HAP–0.5 wt% GNSs–0.5 wt% CNTs; S5, PEEK–10 wt% nano-HAP–0.2 wt% GNSs–0.8 wt% CNTs; S6, PEEK–10 wt% nano-HAP–1 wt% CNTs.
Abbreviations: CNTs, carbon nanotubes; GNSs, graphene nanosheets; HAP, hydroxyapatite; NMP, N-methyl-2-pyrrolidone; PEEK, polyetheretherketone; SEM, scanning electron microscopy.
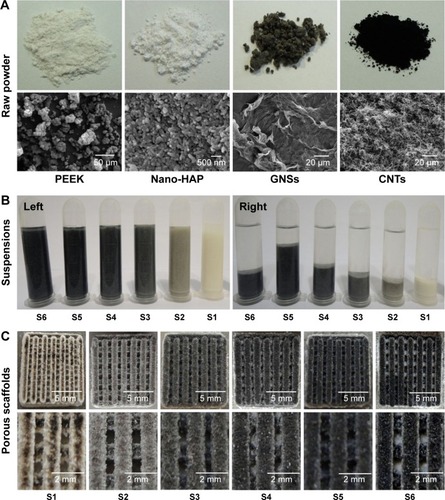
Table 1 Composite scaffolds
Figure 2 XRD patterns and Raman spectra of the raw powder and scaffolds.
Notes: (A) XRD patterns of the raw powder and composite scaffolds, and (B) Raman spectra of GNS and CNT powder and S2, S4, and S6 scaffolds. S2, PEEK–10 wt% nano-HAP–1 wt% GNSs; S4, PEEK–10 wt% nano-HAP–0.5 wt% GNSs–0.5 wt% CNTs; S6, PEEK–10 wt% nano-HAP–1 wt% CNTs.
Abbreviations: CNTs, carbon nanotubes; GNSs, graphene nanosheets; HAP, hydroxyapatite; PEEK, polyetheretherketone; XRD, X-ray diffraction.
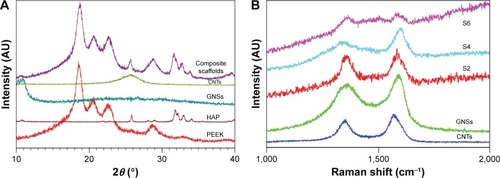
Figure 3 The surface and fracture surface of S1, S2, S6, and S5 scaffolds.
Notes: (A, B) The surfaces were quite smooth and homogeneous. (C, D) GNSs were nonuniformly dispersed in the matrix. (E, F) CNTs were difficult to be uniformly dispersed and aggregated. (G, H) Both GNSs and CNTs were homogeneously dispersed. (A, C, E, and G) SEM micrographs of the surface, (B, D, F, and H) SEM micrographs of the fracture surface, (A, B) S1 scaffold, (C, D) S2 scaffold, (E, F) S6 scaffold, and (G, H) S5 scaffold. S1, PEEK–10 wt% nano-HAP; S2, PEEK–10 wt% nano-HAP–1 wt% GNSs; S5, PEEK–10 wt% nano-HAP–0.2 wt% GNSs–0.8 wt% CNTs; S6, PEEK–10 wt% nano-HAP–1 wt% CNTs.
Abbreviations: CNTs, carbon nanotubes; GNSs, graphene nanosheets; SEM, scanning electron microscopy; HAP, hydroxyapatite; PEEK, polyetheretherketone.
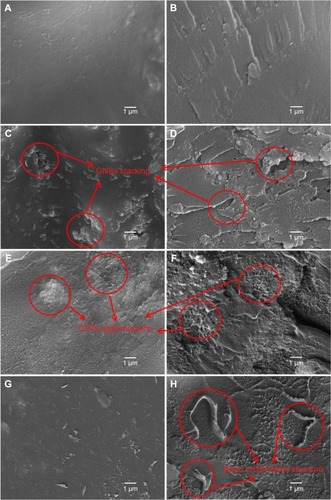
Figure 4 Schematic of the dispersion of GNSs and CNTs in the composite scaffolds.
Notes: (A) GNSs were easily stacked in the matrix. (B–D) The dispersion state of GNSs was significantly improved. (E) CNTs did not disperse well in the matrix. (A) S2 scaffold, (B) S3 scaffold, (C) S4 scaffold, (D) S5 scaffold, and (E) S6 scaffold. S2, PEEK–10 wt% nano-HAP–1 wt% GNSs; S3, PEEK–10 wt% nano-HAP–0.8 wt% GNSs–0.2 wt% CNTs; S4, PEEK–10 wt% nano-HAP–0.5 wt% GNSs–0.5 wt% CNTs; S5, PEEK–10 wt% nano-HAP–0.2 wt% GNSs–0.8 wt% CNTs; S6, PEEK–10 wt% nano-HAP–1 wt% CNTs.
Abbreviations: CNTs, carbon nanotubes; GNSs, graphene nanosheets; HAP, hydroxyapatite; PEEK, polyetheretherketone.
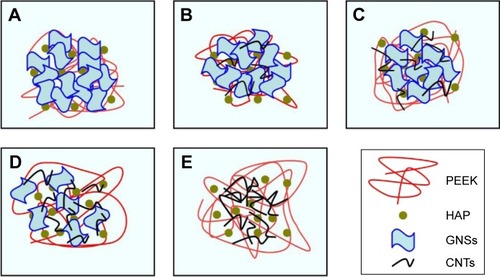
Figure 5 The compressive strength and compressive modulus of the composite scaffolds with different carbon-based fillers.
Notes: Data are presented as mean ± SD (n=6). * and #, statistically significant difference (P<0.05) compared with S1 scaffold; ** and ##, very significant difference (P<0.01) compared with S1 scaffold. S1, PEEK–10 wt% nano-HAP scaffold; S2, PEEK–10 wt% nano-HAP–1 wt% GNSs; S3, PEEK–10 wt% nano-HAP–0.8 wt% GNSs–0.2 wt% CNTs; S4, PEEK–10 wt% nano-HAP–0.5 wt% GNSs–0.5 wt% CNTs; S5, PEEK–10 wt% nano-HAP–0.2 wt% GNSs–0.8 wt% CNTs; S6, PEEK–10 wt% nano-HAP–1 wt% CNTs.
Abbreviations: CNTs, carbon nanotubes; GNSs, graphene nanosheets; HAP, hydroxyapatite; PEEK, polyetheretherketone; SD, standard deviation.
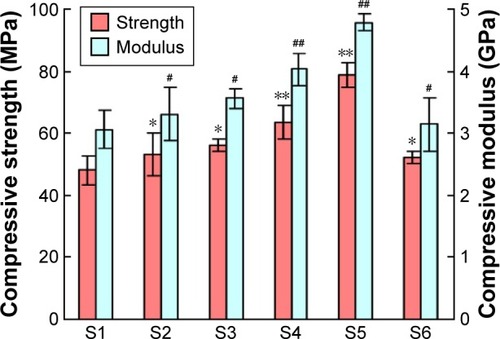
Figure 6 Enhancing mechanisms of carbon-based filler in the nanocomposite scaffolds.
Notes: (A) GNSs, pulling out; (B) GNSs, bridging; (C) CNTs, pulling out; (D) CNTs, bridging; (E) CNTs, dangling; and (F) CNTs, entangling with GNSs. Abbreviations: CNTs, carbon nanotubes; GNSs, graphene nanosheets.
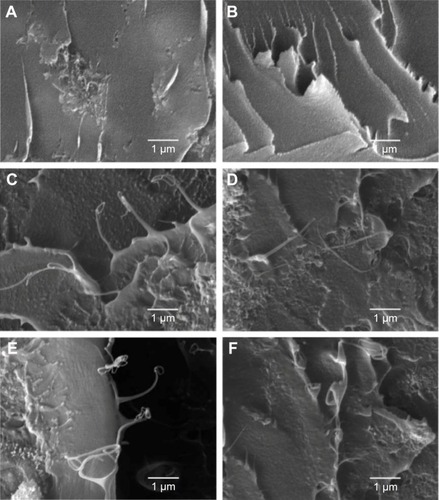
Figure 7 Apatite formation on scaffold surface after immersion in SBF for 7 days.
Notes: Many clustered apatite islands formed (A1–F1), and the morphologies were similar among different scaffolds (A2–F2). The clustered apatite islands were constituted by hundreds of small needle-like aggregates (A3–F3). Ca and P elements were detected in addition to C, O, and Pt elements on the apatite islands (A4–F4). (A1–A4) S1 scaffold, (B1–B4) S2 scaffold, (C1–C4) S3 scaffold, (D1–D4) S4 scaffold, (E1–E4) S5 scaffold, and (F1–F4) S6 scaffold. (A1–F1) Photographs, (A2–F2) low-magnification and (A3–F3) high-magnification SEM images, (A4–F4) EDS spectra. S1, PEEK–10 wt% nano-HAP; S2, PEEK–10 wt% nano-HAP–1 wt% GNSs; S3, PEEK–10 wt% nano-HAP–0.8 wt% GNSs–0.2 wt% CNTs; S4, PEEK–10 wt% nano-HAP–0.5 wt% GNSs–0.5 wt% CNTs; S5, PEEK–10 wt% nano-HAP–0.2 wt% GNSs–0.8 wt% CNTs; S6, PEEK–10 wt% nano-HAP–1 wt% CNTs.
Abbreviations: EDS, energy dispersive spectroscopy; SBF, simulated body fluid; SEM, scanning electron microscopy; CNTs, carbon nanotubes; GNSs, graphene nanosheets; HAP, hydroxyapatite; PEEK, polyetheretherketone.
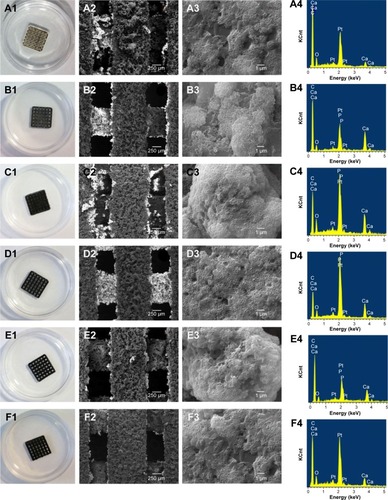
Figure 8 SEM images and fluorescence microscopy images (counterstained with calcein-AM and DAPI for live cell and cell nuclei in green and blue, respectively) of MG-63 cells on S5 scaffold after 1 day, 3 days, 5 days, and 7 days of culture.
Notes: Live cells appeared as bright green dots and related cytoblast as purplish blue dots. S5, PEEK–10 wt% nano-HAP–0.2 wt% GNSs–0.8 wt% CNTs. Abbreviations: DAPI, 4,6-diamidino-2-phenylindole; SEM, scanning electron microscopy; CNTs, carbon nanotubes; GNSs, graphene nanosheets; HAP, hydroxyapatite; PEEK, polyetheretherketone.
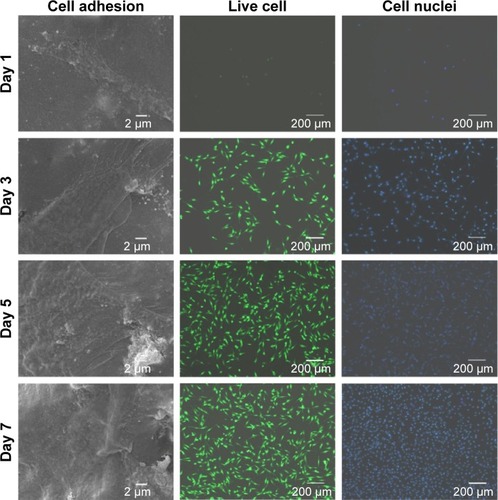
Figure 9 Fluorescence microscopy images of hBMSCs on S5 scaffold after 1 day (A), 3 days (B), 5 days (C), and 7 days (D) of culture.
Notes: The live cells were stained green and dead cells were stained red. S5, PEEK–10 wt% nano-HAP–0.2 wt% GNSs–0.8 wt% CNTs.
Abbreviations: hBMSCs, human bone marrow mesenchymal stem cells; CNTs, carbon nanotubes; GNSs, graphene nanosheets; HAP, hydroxyapatite; PEEK, polyethere-therketone.
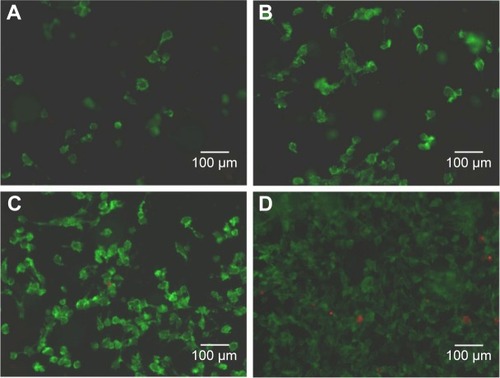
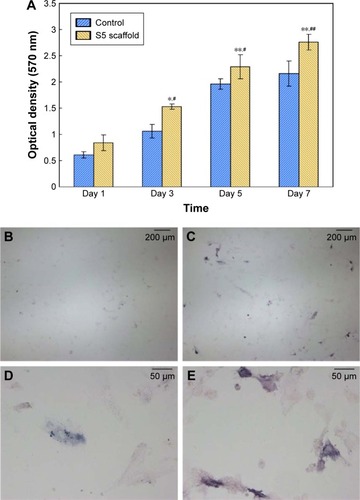
Figure 10 Optical density and ALP staining images.
Notes: (A) Cell proliferation of hBMSCs on control and the S5 scaffold after 1 day, 3 days, 5 days, and 7 days of culture. (B–D) ALP activity of hBMSCs on the S5 scaffold after 3 days (B, D) and 7 days (C, E) of culture. Data are presented as mean ± SD (n=6). *P<0.05 and **P<0.01, compared with the control at the same culture time; #P<0.05 and ##P<0.01, compared with the S5 scaffold after 1 day of culture. (B, C) Low-magnification and (D, E) high-magnification images. S5, PEEK–10 wt% nano-HAP–0.2 wt% GNSs–0.8 wt% CNTs.
Abbreviations: ALP, alkaline phosphatase; hBMSCs, human bone marrow mesenchymal stem cells; SD, standard deviation; CNTs, carbon nanotubes; GNSs, graphene nanosheets; HAP, hydroxyapatite; PEEK, polyetheretherketone.