Figures & data
Table 1 The chemical components and molar ratios of liposomes in this study
Table 2 Size, polydispersity, zeta potential, calcein encapsulation and lipid recovery of liposomes
Figure 1 Percentage release of calcein from the four liposomes under acidic and physiological pHs.
Notes: Calcein-encapsulated liposomes 4%PEG-HS-CHEM-Cal (A), 1%PEG-HS-CHEM-Cal (B), 2%PEG-HS-CHEM-Cal (C) and 4%PEG-HS-Chol-Cal (D) were tested in buffers of pH 4.5, 5.5 and 7.2 at 37°C. Measurements (n=3) were taken at 30 (initial time point), 60, 90, 120 and 180 min, respectively, into incubation. The release of calcein at each time point is expressed as a percentage of total release (mean% ± SD). Release at 30 min was compared to that of all other time points, and the statistical significance is expressed as follows: ns, P>0.05; *P<0.05; **P<0.001; ***P<0.0001.
Abbreviations: PEG, polyethylene glycol; HS, hydrogenated soy; CHEM, cholesteryl hemisuccinate; Cal, calcein; Chol, cholesterol; ns, not significant; SD, standard deviation.
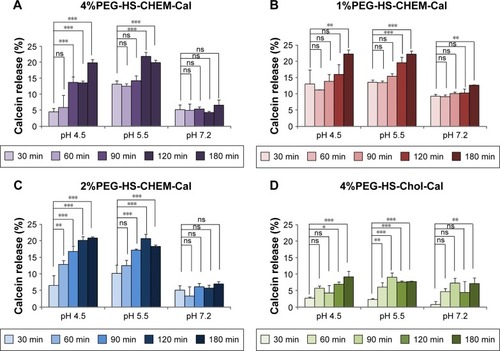
Figure 2 Radiolabeling stability of the four 111In-labeled liposomes under varied serum concentrations and PBS at different time points.
Notes: 111In-labeled 4%PEG-HS-CHEM (A), 1%PEG-HS-CHEM (B), 2%PEG-HS-CHEM (C) and 4%PEG-HS-Chol (D) were incubated in human serum at two different ratios (2 and 0.5 μmol lipid/mL), as well as in PBS (control) at 37°C for evaluation of stability in serum. The stability of each liposome formula is expressed as a percentage of the radiochemical purity of the labeled liposomes (mean% ± SD). Statistical significance between individual serum challenge versus control condition is expressed as follows: ns, P>0.05; *P<0.05; **P<0.001.
Abbreviations: PBS, phosphate-buffered saline; PEG, polyethylene glycol; HS, hydrogenated soy; CHEM, cholesteryl hemisuccinate; Chol, cholesterol; ns, not significant; SD, standard deviation.
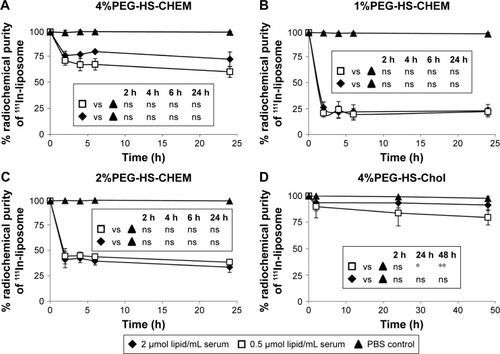
Table 3 Biodistribution of 111In-liposomal nanoparticles in healthy Sprague Dawley rats
Table 4 Kinetic parameters of 4%PEG-HS-Chol and 4%PEG-HS-CHEM
Figure 3 Tissue uptake of 111In-labeled 4%PEG-HS-Chol (A) and 4%PEG-HS-CHEM (B) in healthy rats.
Notes: A group of three animals were sacrificed at 2, 24 and 48 h after the injection of each type of radiolabeled liposome. Tissues (bladder, liver, femur, muscle, spleen, blood, brain, intestine, kidney, heart, lung, stomach, thyroid and testis) were extracted for gamma counting and weight measurement. The uptake values are expressed as the percentage of injected dose per gram (%ID/g ± SD).
Abbreviations: PEG, polyethylene glycol; HS, hydrogenated soy; Chol, cholesterol; CHEM, cholesteryl hemisuccinate; SD, standard deviation.
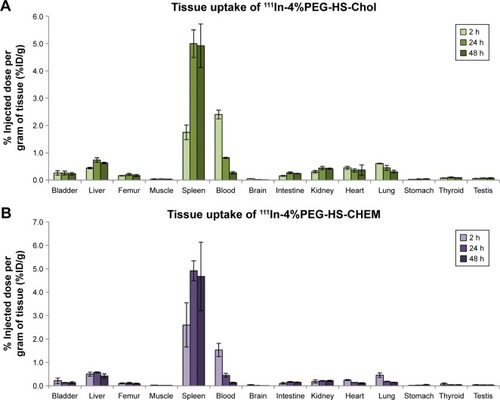
Figure 4 Accumulation of 111In-labeled 4%PEG-HS-Chol and 4%PEG-HS-CHEM.
Notes: The majority of injected liposomes (expressed as percentage of injected dose %ID ± SD, n=3) were found in liver (A), intestine (B), spleen (C) and kidney (D). Statistical significance between the two formulas is expressed as follows: *P<0.05; **P<0.001.
Abbreviations: PEG, polyethylene glycol; HS, hydrogenated soy; Chol, cholesterol; CHEM, cholesteryl hemisuccinate; SD, standard deviation.
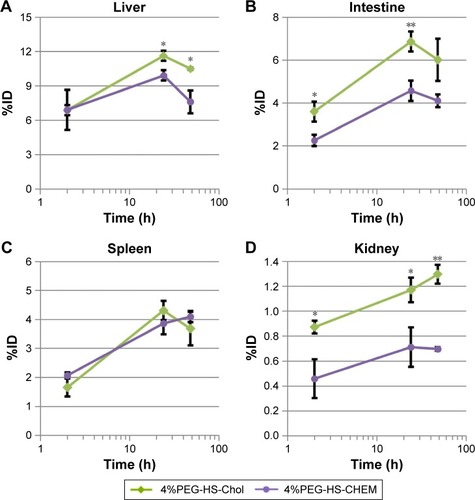
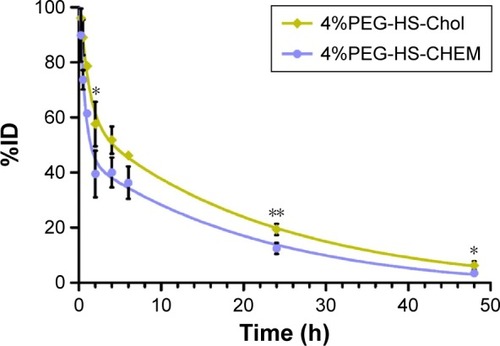
Figure 5 Blood clearance of 111In-labeled 4%PEG-HS-Chol and 4%PEG-HS-CHEM.
Notes: The percentage of injected liposome (%ID ± SD, n=5 at 2, 24 and 48 h, n=2 for the rest) in blood was calculated and plotted against time. A two-compartment elimination curve was used to model the blood activity over time for both formulas: 4%PEG-HS-Chol, y=43.26e−0.6732x+56.74e−0.04492x, r2=0.993; 4%PEG-HS-CHEM, y=55. 23e−1.190x+44.77e−0.05057x, r2=0.991. Statistical significance between the two formulas is expressed as follows: *P<0.05; **P<0.001.
Abbreviations: PEG, polyethylene glycol; HS, hydrogenated soy; Chol, cholesterol; CHEM, cholesteryl hemisuccinate; SD, standard deviation.