Figures & data
Table 1 Primers used for quantitative real-time PCR for the analysis of apoptotic, antiapoptotic, and autophagy gene expression
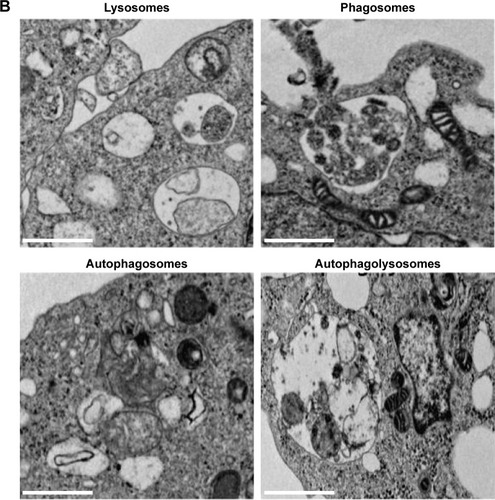
Figure 1 Synthesis and characterization of AgNPs using Bacillus clausii.
Notes: (A) The absorption spectrum of AgNPs synthesized by the culture supernatant of Bacillus clausii. (B) X-ray diffraction spectra of AgNPs. (C) Fourier transform infrared spectra of AgNPs. (D) Measurement of size distribution of AgNPs by DLS. (E) TEM images of AgNPs. (F) Several fields were used to measure the AgNP particle size; micrograph shows size distributions based on TEM images of AgNPs ranging from 8 nm to 20 nm. *Indicate the nonspecific peaks due to organic compounds.
Abbreviations: AgNPs, silver nanoparticles; DLS, dynamic light scattering; TEM, transmission electron microscopy.
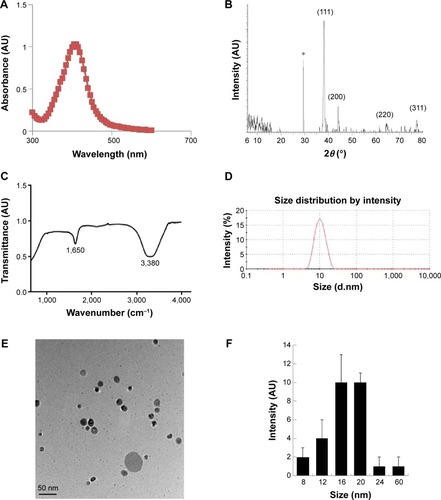
Figure 2 Dose-dependent effect of Sal and AgNPs on cell viability of human breast cancer cells.
Notes: (A) The human breast cancer cells (MDA-MB-231) were incubated with various concentrations of Sal (0–20 µM) or AgNPs (0–20 µg/mL) for 24 hours, and the cell viability was measured using WST-8 assay. (B) The human ovarian cancer cells (A2780) were incubated with various concentrations of Sal (0–20 µM) or AgNPs (0–20 µg/mL) for 24 hours, and the cell viability was measured using WST-8 assay. The results are expressed as mean ± standard deviation of three independent experiments. The treated groups showed statistically significant differences from the control group by the Student’s t-test (*P<0.05).
Abbreviations: AgNPs, silver nanoparticles; MDA, malondialdehyde; Sal, salinomycin.
Figure 3 Combination effect of Sal and AgNPs on cell viability of human ovarian cancer cells.
Notes: (A) The human ovarian cancer cells were incubated with Sal (3 µM), AgNPs (4 µg/mL), or a (B) combination of Sal (3 µM) and different doses of AgNPs (4–16 µg/mL) for 24 hours. The results are expressed as mean ± standard deviation of three independent experiments. The treated groups showed statistically significant differences from the control group by the Student’s t-test (*P<0.05).
Abbreviations: AgNPs, silver nanoparticles; Con, control; Sal, salinomycin.
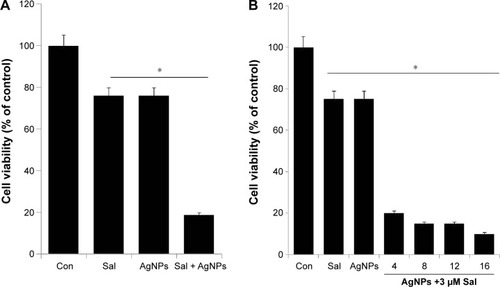
Figure 4 Effect of Sal or AgNPs alone or combination effect of Sal and AgNPs on cell morphology of human ovarian cancer cells.
Notes: The human ovarian cancer cells were incubated with Sal (3 µM), AgNPs (4 µg/mL), or both Sal (3 µM) and AgNPs (4 µg/mL) for 24 hours. Treated cells were photographed under a light microscope (200 µm).
Abbreviations: AgNPs, silver nanoparticles; Con, control; Sal, salinomycin.
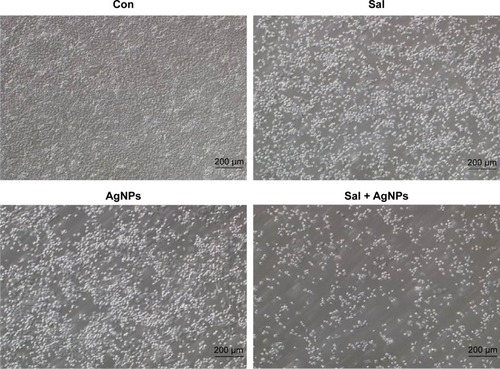
Figure 5 Effect of Sal, AgNPs, or both Sal and AgNPs on cytotoxicity in human ovarian cancer cells.
Notes: (A) The cells were treated with Sal (3 µM), AgNPs (4 µg/mL), or the combination of Sal (3 µM) and AgNPs (4 µg/mL) for 24 hours. LDH activity was measured at 490 nm using the LDH Cytotoxicity Kit. (B) ROS were measured with relative fluorescence of 2′,7′-dichlorofluorescein using a spectrofluorometer. The results are expressed as mean ± standard deviation of three independent experiments. The treated groups showed statistically significant differences from the control group by the Student’s t-test (*P<0.05).
Abbreviations: AgNPs, silver nanoparticles; Con, control; LDH, lactate dehydrogenase; ROS, reactive oxygen species; Sal, salinomycin.
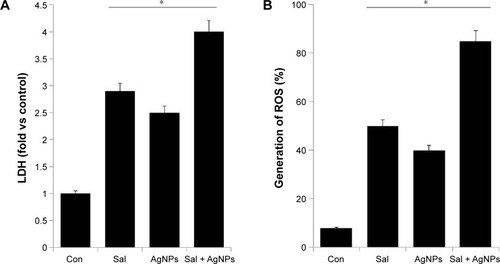
Figure 6 Effect of Sal, AgNPs, or both Sal and AgNPs on oxidative stress markers in human ovarian cancer cells.
Notes: (A) The cells were treated with Sal (3 µM), AgNPs (4 µg/mL), or both Sal (3 µM) and AgNPs (4 µg/mL) for 24 hours. After incubation, the cells were harvested and washed twice with an ice-cold PBS solution. The cells were collected and disrupted by ultrasonication for 5 minutes on ice. The concentration of MDA was expressed as nanomole per milligram of protein. (B) The concentration of GSH was expressed as milligram per gram of protein. (C) The specific activity of SOD was expressed as unit per milligram of protein. (D) The specific activity of CAT was expressed as unit per milligram of protein. The results are expressed as mean ± standard deviation of three independent experiments. There was a significant difference in the treated cells compared to that of the untreated cells by the Student’s t-test (*P<0.05).
Abbreviations: AgNPs, silver nanoparticles; CAT, catalase; Con, control; GSH, glutathione; MDA, malondialdehyde; PBS, phosphate-buffered saline; Sal, salinomycin; SOD, superoxide dismutase.
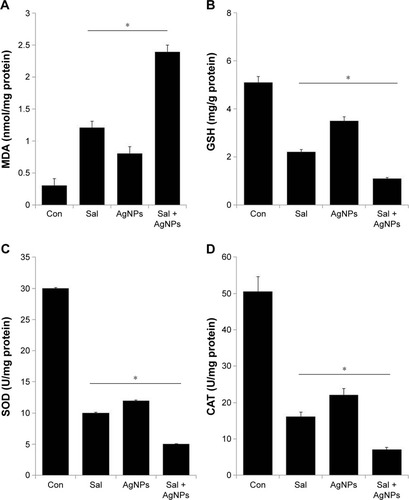
Figure 7 Effect of Sal or AgNPs alone or combination effect of Sal and AgNPs on MMP.
Notes: The cells were treated with Sal (3 µM), AgNPs (4 µg/mL), or both Sal (3 µM) and AgNPs (4 µg/mL) for 24 hours. MMP (ratio of JC-1 aggregate to monomer) in ovarian cancer cells was determined after treatment. The results are expressed as mean ± standard deviation of three independent experiments. The treated groups showed statistically significant differences from the control group by the Student’s t-test (*P<0.05).
Abbreviations: AgNPs, silver nanoparticles; Con, control; MMP, mitochondrial membrane potential; Sal, salinomycin.
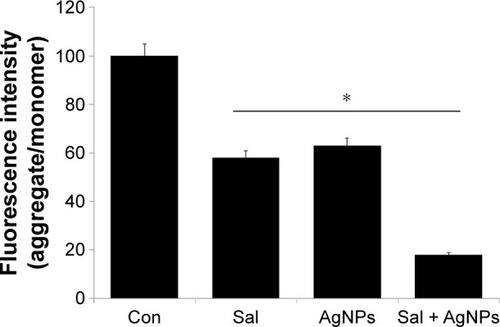
Figure 8 Impact of Sal or AgNPs alone or combination effect of Sal and AgNPs on the expression of apoptotic and antiapoptotic gene expression.
Notes: Relative mRNA expression was analyzed by qRT-PCR in human ovarian cancer cells after the treatment with Sal (3 µM), AgNPs (4 µg/mL), or both Sal (3 µM) and AgNPs (4 µg/mL) for 24 hours. The results are expressed as mean ± standard deviation of three independent experiments. The treated groups showed statistically significant differences from the control group by the Student’s t-test (*P<0.05). Cells were treated with the Sal (3 µM), AgNPs (4 µg/mL), or both Sal (3 µM) and AgNPs (4 µg/mL) for 24 hours. Cell lysates were harvested and subjected to Western blot analysis using antibodies against pro-caspase-3. β-actin was used as a loading control.
Abbreviations: AgNPs, silver nanoparticles; Con, control; qRT-PCR, quantitative reverse transcription polymerase chain reaction; Sal, salinomycin.
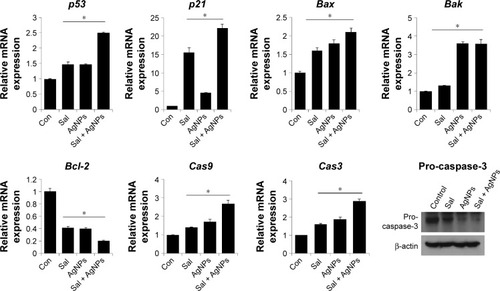
Figure 9 Effect of Sal, AgNPs, or both Sal and AgNPs on caspase-3 activity.
Notes: The cells were treated with Sal (3 µM), AgNPs (4 µg/mL), or both Sal (3 µM) and AgNPs (4 µg/mL) with or without the caspase-3 inhibitor Ac-DEVD-CHO for 24 hours. The concentration of p-nitroanilide released from the substrate was calculated from the absorbance at 405 nm. The results are expressed as mean ± standard deviation of three independent experiments. The treated groups showed statistically significant differences from the control group by the Student’s t-test (*P<0.05).
Abbreviations: AgNPs, silver nanoparticles; Con, control; Sal, salinomycin.
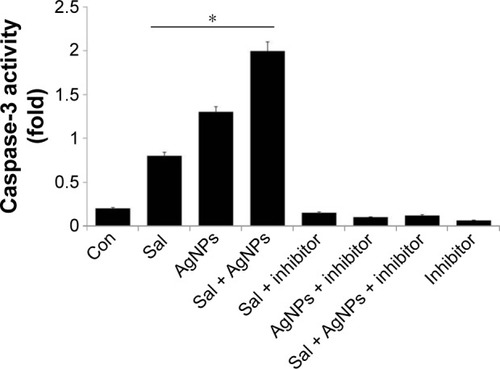
Figure 10 Effect of Sal or AgNPs alone or the combination effect of Sal and AgNPs on apoptosis in human ovarian cancer cells.
Notes: The cells were treated with Sal (3 µM), AgNPs (4 µg/mL), or both Sal (3 µM) and AgNPs (4 µg/mL) for 24 hours. Apoptosis of human ovarian cancer cells after a 24-hour treatment was assessed by the TUNEL assay; the nuclei were counterstained with DAPI. Representative images show apoptotic (fragmented) DNA (red staining) and the corresponding cell nuclei (blue staining). Scale bar 200 µm.
Abbreviations: AgNPs, silver nanoparticles; Con, control; Sal, salinomycin.
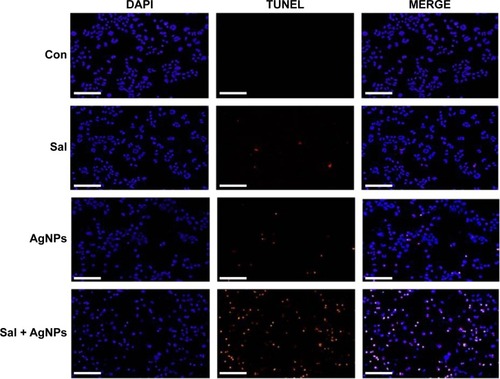
Figure 11 Impact of Sal or AgNPs or combination effect of Sal and AgNPs on the expression of autophagy regulated genes.
Notes: Relative mRNA expression was analyzed by qRT-PCR in human ovarian cancer cells after the treatment with Sal (3 µM), AgNPs (4 µg/mL), or both Sal (3 µM) and AgNPs (4 µg/mL) for 24 hours. The results are expressed as mean ± standard deviation of three independent experiments. The treated groups showed statistically significant differences from the control group by the Student’s t-test (*P<0.05).
Abbreviations: AgNPs, silver nanoparticles; Con, control; qRT-PCR, quantitative reverse transcription polymerase chain reaction; Sal, salinomycin.
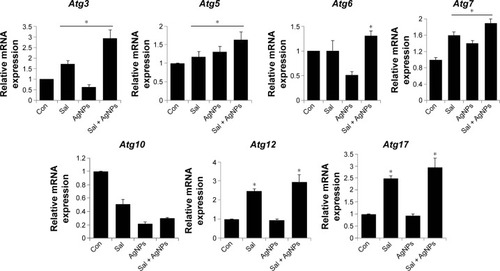
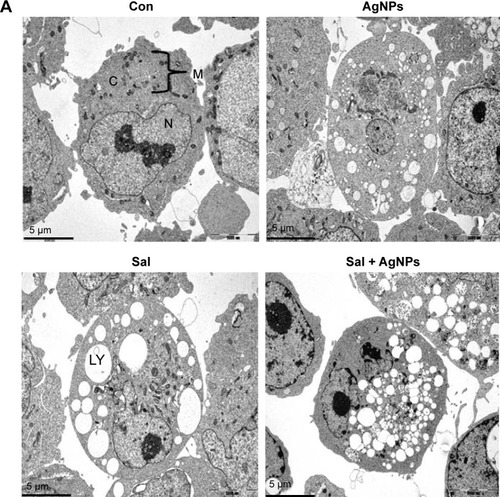
Figure 12 Combination of Sal and AgNPs induces accumulation of autophagolysosomes along with lysosomes, phagosomes, and autophagosomes.
Notes: (A) The cells were treated with and without Sal (3 µM) or AgNPs (4 µg/mL) or both Sal (3 µM) and AgNPs (4 µg/mL) for 24 hours and then processed for TEM. Sal-treated, AgNPs-treated, or Sal plus AgNPs-treated cells show an increased number of autophagolysosomes formed along with lysosomes, phagosomes, and autophagosomes. (B) Individual portraits of lysosomes, phagosomes, autophagosomes, and autophagolysosomes. Scale bar 1 µm.
Abbreviations: AgNPs, silver nanoparticles; C, cytoplasm; Con, control; LY, lysosomes; M, mitochondria; N, nucleus; Sal, salinomycin; TEM, transmission electron microscopy.