Figures & data
Figure 1 Characterization of ZnO NPs by TEM, SEM, and DLS.
Notes: (A) A representative TEM and (B) size distribution of ZnO NPs scored on several fields of TEM images. (C) SEM 8B9 images of ZnO NPs. (D) Measurement of size distribution of ZnO NPs by DLS. Scale bars =150 μm.
Abbreviations: au, absorbance units; DLS, dynamic light scattering; NPs, nanoparticles; SEM, scanning electron microscopy; TEM, transmission electron microscopy.
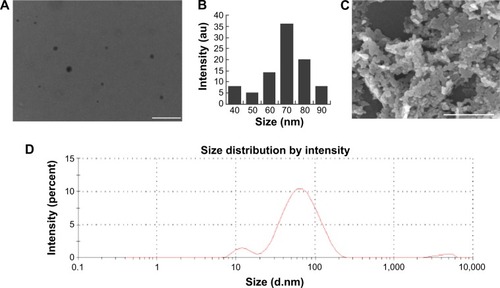
Figure 2 XRD and FITR spectra of ZnO NPs.
Notes: (A) XRD spectrum; note seven intense peaks across the spectrum of 2θ values ranging from 25° to 75°. The peaks at 2θ = 31.7°, 34.4°, 36.2°, 47.5°, 56.6°, 62.8°, 66.28°, 68.0°, 69.03°, and 72.48° were assigned to (100), (002), (101), (102), (110), (103), (200), (112), and (201) of ZnO NPs, indicating that the samples were polycrystalline wurtzite structure (Zincite, JCPDS 5-0664). No characteristic peaks of any impurities were detected, suggesting that high-quality ZnO NPs were synthesized. (B) FITR spectra show peaks at 3,440 cm−1 (phosphorous compounds, secondary sulfonamide), 2,922 cm−1 (monosubstituted alkynes, β-lactones, amine salts), 1,627 cm−1 (medium charge vinyl, cis-tri substituted), 1,396 cm−1 (amide II), and 1,047 cm−1 (monosubstituted alkyne).
Abbreviations: au, absorbance units; FITR, Fourier transform infrared spectroscopy; NPs, nanoparticles; XRD, X-ray diffraction.
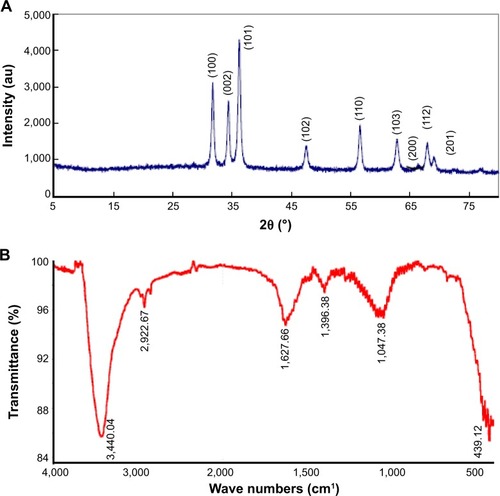
Figure 3 Scanning probe microscopy of noncontact AFM images of the ZnO NPs.
Notes: (A) Analysis of individual particle sizes (a–h). (B) a–b size is 58.27 nm and c–d size is 67.61 nm.
Abbreviations: AFM, atomic force microscopy; NPs, nanoparticles.
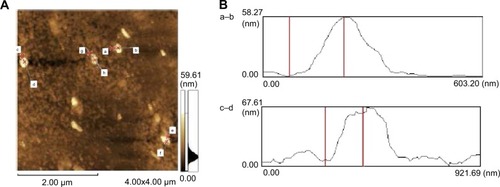
Figure 4 TEM observations of ZnO NP internalization by LCs and SCs.
Notes: (A) (a) Untreated LCs, (b–d) localization of ZnO NPs within the Cy and N of the LCs; bottom row = magnifications of the framed region. (B) (a) Untreated SCs, (b–d) localization of ZnO NPs within the SCs; bottom row = magnifications of the framed region. Black arrows indicate ZnO NPs and white arrows indicate the intramembranous space between the inner and outer membranes of the nuclear envelope.
Abbreviations: Av, autophagic vacuoles; Cy, cytoplasm; LCs, Leydig cells; N, nucleus; NPs, nanoparticles; SCs, Sertoli cells; TEM, transmission electron microscopy.
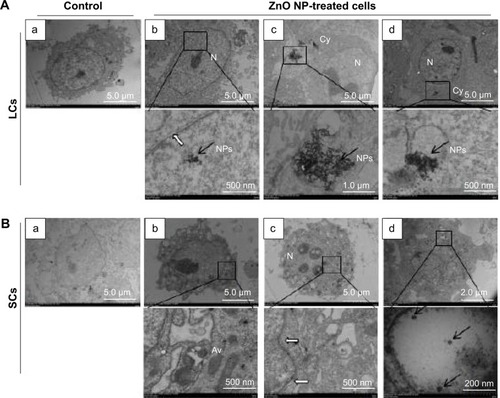
Figure 5 Viability and TUNEL histochemistry of LCs and SCs after ZnO NP treatments.
Notes: In order to verify ZnO NPs cytotoxicity, cells were treated with various concentrations of ZnO NPs for 12 and 24 h and viability determined with (A and B) MTT and (C and D) LDH assays. (E and F) Apoptosis was detected by the TUNEL histochemistry in cells treated for 0, 3, 6, and 12 h with 15 μg/mL ZnO NPs. (A, C, E, and G) are the data of LCs; (B, D, F, and H) are the data of SCs. Scale bars =150 μm. The results are expressed as the mean ± standard deviation of three separate experiments, in triplicate. *P<0.05, **P<0.01.
Abbreviations: DAPI, 4′,6-diamidino-2-phenylindole; LCs, Leydig cells; LDH, lactate dehydrogenase; MTT, 3-(4,5-dimethylthiazol-2-yl)-2,5-diphenyltetrazolium bromide; NPs, nanoparticles; SCs, Sertoli cells; TUNEL, terminal deoxynucleotidyl transferase dUTP nick end labeling; TEM, transmission electron microscopy; h, hours.
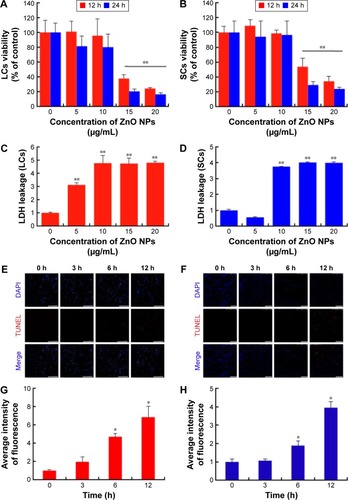
Figure 6 Evaluation of ROS level and mitochondrial membrane potential in LCs and SCs after ZnO NP treatment.
Notes: (A) Intracellular ROS levels were measured with fluorescence imaging using the DCFH-DA probe in cells cultured in the presence of increasing concentration of ZnO NPs for 6 hours. Scale bars =100 μm. (B) Mitochondrial membrane potential (ΔΨm) was evaluated using JC-1 in cells treated with 15 μg/mL ZnO NPs for 0, 3, 6, and 12 hours. Red fluorescence indicates JC-1 aggregates within the mitochondria in healthy cells, whereas green fluorescence indicates JC-1 monomers in the cytoplasm and loss of Δψm. Scale bars =100 μm.
Abbreviations: DCFH-DA, dichloro-dihydro-fluorescein diacetate; LCs, Leydig cells; NPs, nanoparticles; ROS, reactive oxygen species; SCs, Sertoli cells; h, hours.
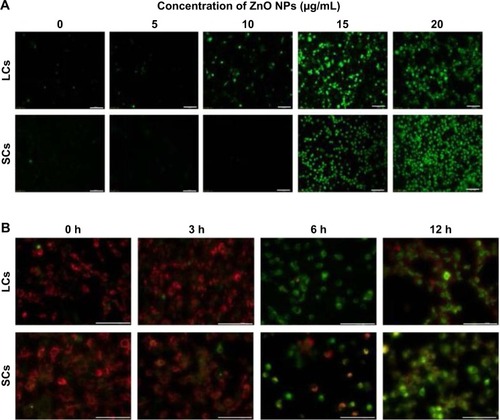
Figure 7 Nuclear DNA leakage in LCs and SCs after ZnO NP treatment.
Notes: (A) DAPI staining shows nuclear DNA leakage (arrows) in cells incubated in the presence of ZnO NPs. Number of LCs (B) and SCs (C) with nuclear DNA leakage after 12 and 24 hours in the presence of ZnO NPs. The results are expressed as the mean ± standard deviation of three separate experiments, in triplicate. **P<0.01.
Abbreviations: DAPI, 4′,6-diamidino-2-phenylindole; LCs, Leydig cells; NPs, nanoparticles; SCs, Sertoli cells; h, hours.
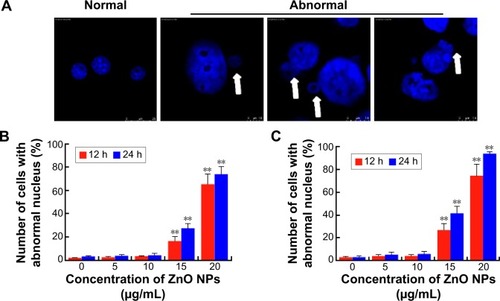
Figure 8 Nuclear DNA damage in LCs and SCs after ZnO NP treatment.
Notes: (A and B) Nuclear γ-H2AX foci in cells exposed in vitro to ZnO NPs for 12 hours. (C and D) Nuclear RAD51 foci in cells exposed in vitro to ZnO NPs for 12 hours. (E and F) Western blots for γ-H2AX and RAD51 in LCs and SCs. The results are expressed as the mean ± standard deviation of three separate experiments, in triplicate. (A, C, and E) are the data of LCs; (B, D, and F) are the data of SCs. Scale bars =150 μm.
Abbreviations: DAPI, 4′,6-diamidino-2-phenylindole; LCs, Leydig cells; NPs, nanoparticles; SCs, Sertoli cells.
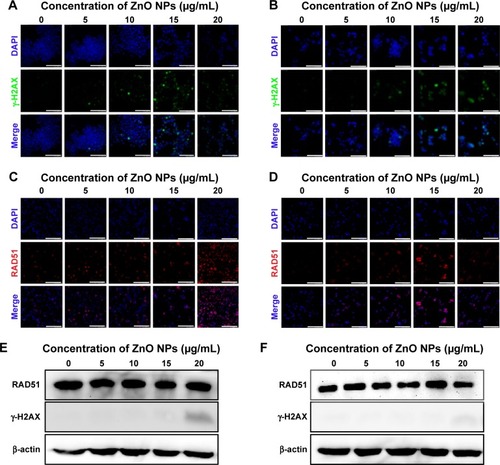
Figure 9 Structural alteration of seminiferous tubules and abnormal sperm morphologies of mice injected with ZnO NPs.
Notes: (A) Representative histological sections of control and treated testes. Scale bars =100 μm. (B) Measures of the seminiferous epithelium thickness of testicular tubules of control and treated mice. (C) Measures of the diameter of the seminiferous tubules of control and treated mice. (D) Percentage of abnormal sperm morphologies (double head, small head, unshaped head, double tail) in control and treated mice. The results are expressed as the mean ± standard deviation of three separate experiments, in triplicate. *P<0.05, **P<0.01.
Abbreviations: NPs, nanoparticles; PND, postnatal day.
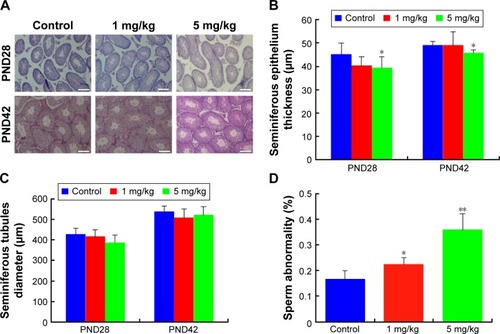
Figure S1 ZnO NPs exposure increases autophagy in cultured LC and SC cell lines in 12 h.
Notes: (A) LC3-stained LCs: (a) the average intensity of LC3 fluorescence in LCs. (B) LC3-stained SCs: (b) the average intensity of LC3 fluorescence in SCs. Scale bars =100 μm. **P<0.01.
Abbreviations: DAPI, 4′,6-diamidino-2-phenylindole; LCs, Leydig cells; NPs, nanoparticles; SCs, Sertoli cells.
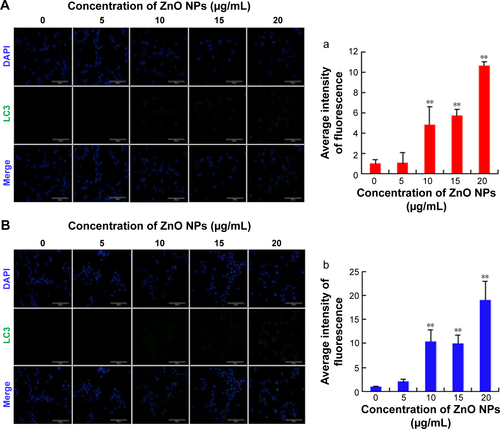
Figure S2 Toxicity of ZnSO4·7H2O for LCs and SCs, and dissolution curve of Zn2+ from different concentrations of ZnO NPs and ZnSO4·7H2O in medium.
Notes: (A and B) In order to verify ZnSO4·7H2O cytotoxicity, cells were treated with various concentrations of ZnSO4·7H2O for 12 and 24 hours, and viability determined with MTT. MTT indicated time- and concentration-dependent cytotoxicity of ZnSO4·7H2O on both cell lines. On comparing the effects of ZnO NPs on the two cell lines with the MTT assay, the ZnO NPs showed hazardous effects than ZnSO4·7H2O. (C) Dissolution curve of Zn2+ from different concentrations of ZnO NPs in medium. (D) Dissolution curve of Zn2+ from different concentrations of ZnSO4·7H2O in medium. More Zn2+ was released from ZnSO4·7H2O than ZnO NPs at the highest concentration. This shows that the ZnO NP toxicity was dependent on the particle and not on the released Zn2+. Also, 17.665, 35.33, 52.995, and 70.66 μg/mL ZnSO4·7H2O have the same concentration zinc with 5, 10, 15, and 20 μg/mL ZnO NPs, respectively. The results are expressed as the mean ± standard deviation of three separate experiments.
Abbreviations: LCs, Leydig cells; MTT, 3-(4,5-dimethylthiazol-2-yl)-2,5-diphenyltetrazolium bromide; NPs, nanoparticles; SCs, Sertoli cells; h, hours.
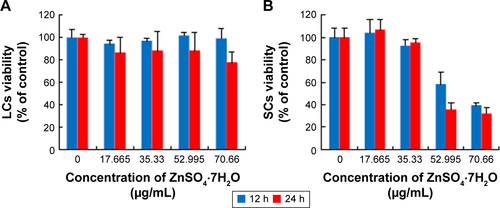
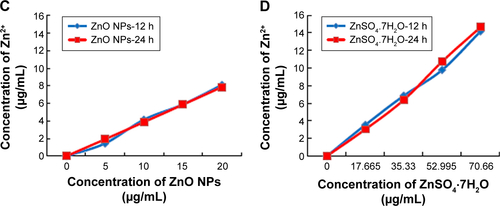
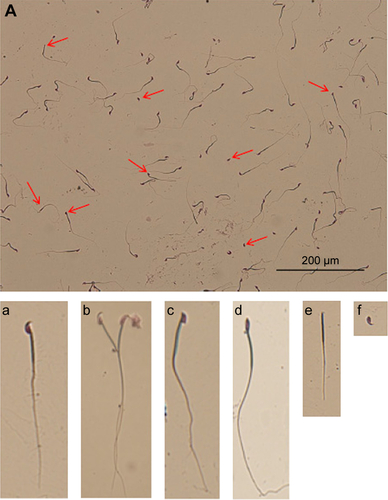
Figure S3 Picture of sperm morphologies.
Notes: (A) Picture of sperm morphologies and abnormal sperm (red arrows). (a) Normal sperm. (b) Abnormal sperm with two heads and two tails. (c, d) Abnormal sperm with head deformities. (e) Abnormal sperm with no head. (f) Abnormal sperm with no tail.