
Figures & data
Table 1 The average dn, ζ, and PI of SLN containing different amount of DOTAP
Table 2 The average dn, ζ, and PI of SLN/miRNA complexes containing different amount of SLN to miRNA
Figure 1 Transmission electron microscopic images of (A) SLN with 20 wt% DOTAP, (B) SLN/miRNA (SLN containing 20 wt% DOTAP, 60:1, w/w), (C) SLN/miRNA (SLN containing 20 wt% DOTAP, 90:1, w/w), (D) NLC, and (E) NLC/PTX. Magnification is 100,000×.
Abbreviations: DOTAP, 1,2-dioleoyl-3-trimethylammonium-propane; NLC, nanostructured lipid nanoparticles; PTX, paclitaxel; SLN, solid lipid nanoparticles.
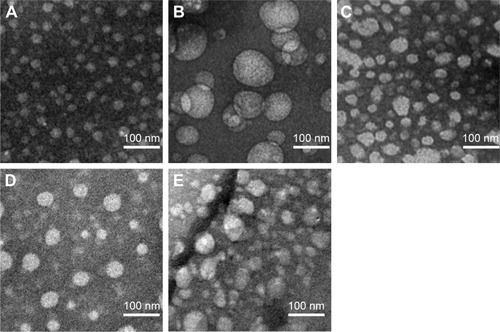
Figure 2 Gel retardation analyses (A) of SLN/miRNA complexes prepared at different weight ratios and RNase A protection assay (B) of SLN/miRNA complexes.
Notes: In (B), lanes 1–4 represent naked miRNA, naked miRNA + RNase, SLN/miRNA, and SLN/miRNA + RNase, respectively. SLN/miRNA complexes were prepared at the weight ratio of 90.
Abbreviation: SLN, solid lipid nanoparticles.
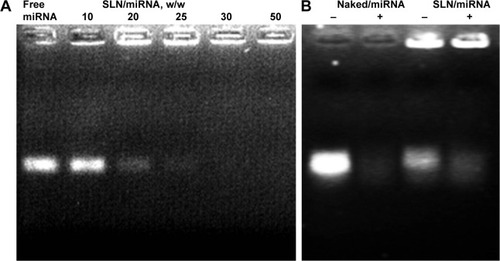
Figure 3 Release profiles (A) of miRNA from SLN/miRNA complexes with different weight ratios in Tris-base (n=3). Lines a, b, and c represent SLN/miRNA nanoparticles at the weight ratio of 60:1, 90:1, and 120:1, respectively. Release profiles (B) of PTX from NLC/PTX. The error bars in the graphs represent the standard deviations (n=3).
Abbreviations: NLC, nanostructured lipid nanoparticles; PTX, paclitaxel; SLN, solid lipid nanoparticles; miRNA, microRNA.
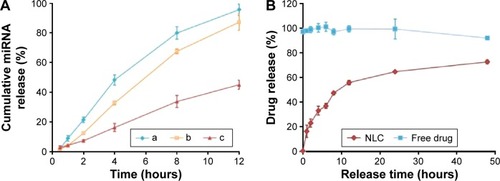
Figure 4 Light microscope images of mammospheres after incubation for 4, 7, and 9 days, respectively.
Note: Scale bar: 100 μm, magnification: 200×.
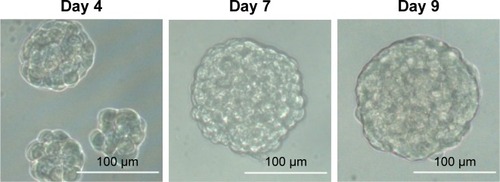
Figure 5 Mammospheres were treated with miR-200c, SLN/miR-200c, and Lipofectamine™ 2000/miR-200c, respectively.
Notes: Untreated spheres were the blank control. After 24 hours, RNA was harvested and miR-200c levels were determined by real-time PCR (*P<0.05, compared with Lipofectamine™ 2000/miR-200c group).
Abbreviations: PCR, polymerase chain reaction; SLN, solid lipid nanoparticles; Lipo, Lipofectamine™ 2000.
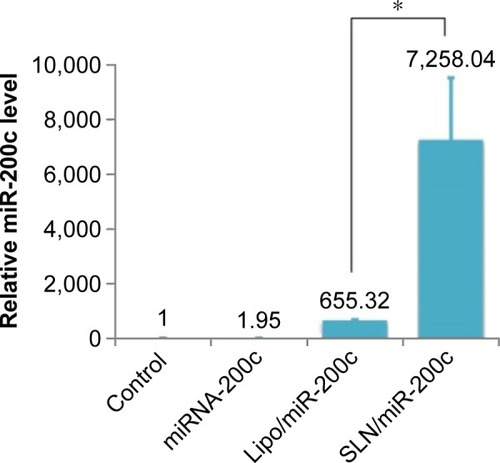
Figure 6 Intracellular miRNA release profiles of SLN/miRNA complexes.
Notes: The mammospheres were treated with enzyme to obtain single-layer cells and then incubated with FITC-SLN/miRNA-CY3 for 4 hours. Then, the incubation medium was removed and replaced, and the cells were observed for the next 0, 4, and 12 hours. (A) and (B) represent colocalization micrographs and analysis of SLN with miRNA, respectively. The green color represents SLN, and the red color represents miRNA. Area a (FITC-labeled SLN) overlap b (CY-3-labeled miRNA) represents the proportion of SLN that was occupied by miRNA, and area b overlap a shows the proportion of miRNA that was occupied by SLN. Scale bar: 20 μm.
Abbreviations: FITC, fluorescein isothiocyanate; SLN, solid lipid nanoparticles.
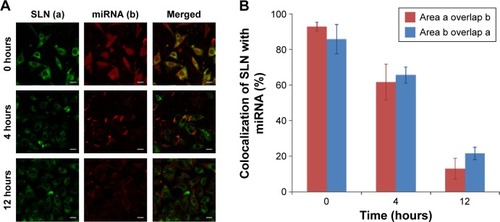
Figure 7 TUBB3 mRNA expression (A) and protein expression (B) after transfection.
Abbreviations: SLN, solid lipid nanoparticles; TUBB3, class III beta-tubulin.
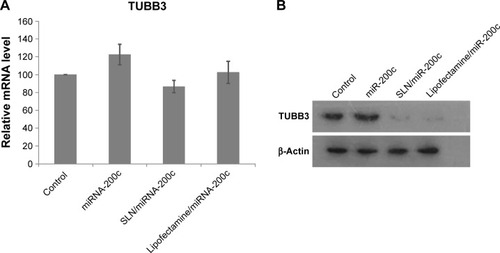
Figure 8 Single section images (A) and stacked images (B) of mammospheres after incubation with FITC-labeled NLC for 12 hours. Single section images (C) and stacked images (D) of mammospheres after incubation with FITC-labeled NLC for 24 hours. Scale bar: 100 μm.
Abbreviations: FITC, fluorescein isothiocyanate; NLC, nanostructured lipid nanoparticles.
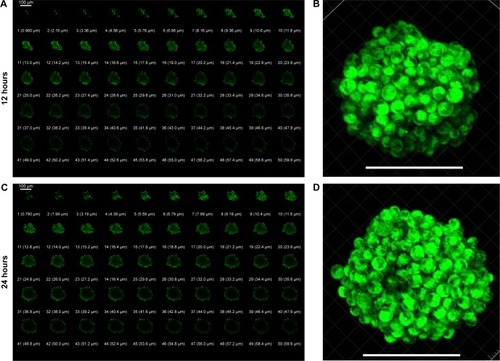
Figure 9 (A) Cell viabilities of SLN, SLN/miRNA NC, Lipofectamine™ 2000, and Lipofectamine™ 2000/miRNA NC; (B) Light microscope images of mammospheres under different treatments, scale bar: 100 μm; and (C) Cell viabilities of NLC at various concentrations. *P<0.05, **P<0.01.
Abbreviations: NLC, nanostructured lipid nanoparticles; SLN, solid lipid nanoparticles; SLN/miRNA NC, SLN/miRNA negative control.
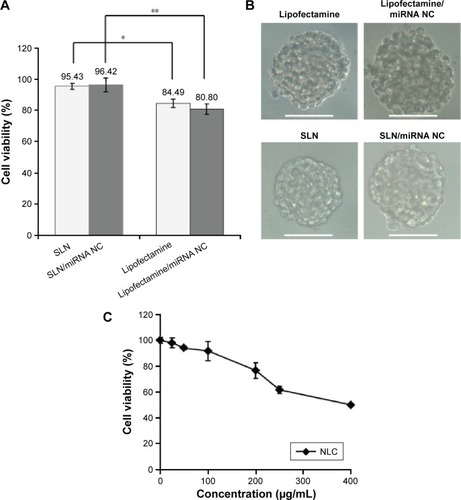
Table 3 IC50 values of taxol and NLC/PTX against mammospheres after transfection