Figures & data
Figure 1 (A) Chemical structure of Her2 peptide and (B) 1H NMR spectrum of pep-TPGS2k in DMSO-d6.
Abbreviations: d6, 1H NMR spectrum; DMSO, dimethyl sulfoxide; 1H NMR, proton nuclear magnetic resonance; TPGS2k, d-α-tocopheryl polyethylene glycol 2000; pep-TPGS2k, Her2 peptide-modified TPGS2k.
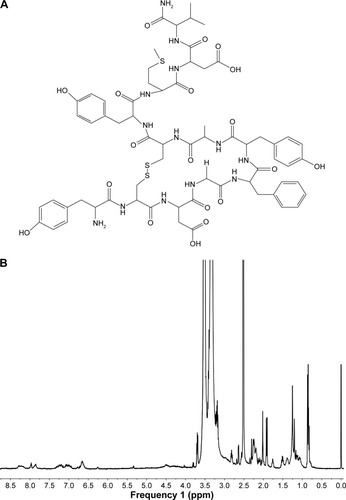
Table 1 Characterization of HTM and PHTM copolymer micelles
Figure 2 (A) Particle size distribution and (B) TEM image of PHTM micelles.
Abbreviations: HA, hyaluronic acid; PHis, poly(L-histidine); PHTM, HA-PHis/pep-TPGS2k mixed micelles; pep-TPGS2k, Her2 peptide-modified TPGS2k; TEM, transmission electron microscopy; TPGS2k, d-α-tocopheryl polyethylene glycol 2000.
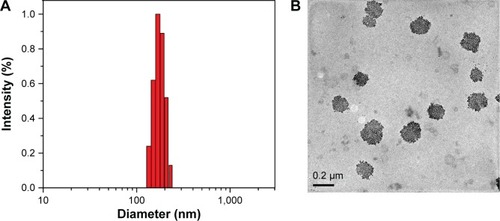
Figure 3 (A) pH-dependent release of DOX from PHTM and HTM at 37°C and (B) cytotoxicity of free DOX, HTM, and PHTM against MCF-7 and MDA-MB-231 cells.
Notes: Data expressed as mean ± standard deviation (n=3). *P<0.05.
Abbreviations: DOX, doxorubicin; HA, hyaluronic acid; HTM, HA-PHis/TPGS2k mixed micelles; IC50, concentration inducing 50% loss of cell viability; NS, not significant; pep-TPGS2k, Her2 peptide-modified TPGS2k; PHis, poly(L-histidine); PHTM, HA-PHis/pep-TPGS2k mixed micelles; TPGS2k, d-α-tocopheryl polyethylene glycol 2000.
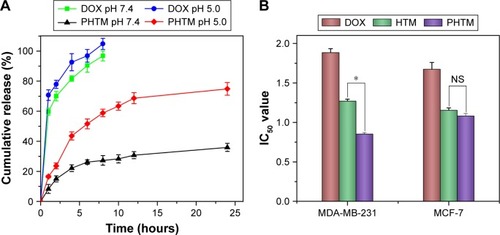
Figure 4 Flow cytometry measurement of the intracellular uptake of free DOX, HTM, and PHTM in MCF-7 cells (A) and MDA-MB-231 cells (B) and the fluorescence intensity of DOX accumulation at 4 hours in MCF-7 cells (C) and MDA-MB-231 cells (D), respectively.
Notes: *P<0.05. Data expressed as mean ± standard deviation (n=3).
Abbreviations: DOX, doxorubicin; HA, hyaluronic acid; HTM, HA-PHis/TPGS2k mixed micelles; NS, not significant; pep-TPGS2k, Her2 peptide-modified TPGS2k; PHis, poly(L-histidine); PHTM, HA-PHis/pep-TPGS2k mixed micelles; TPGS2k, d-α-tocopheryl polyethylene glycol 2000.
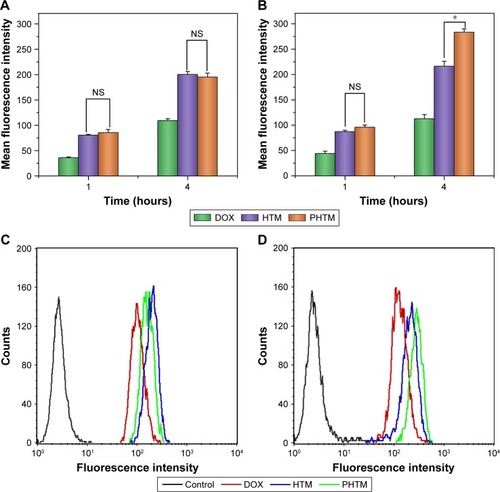
Figure 5 CLSM images of MDA-MB-231 cells after 1 h and 4 h of incubation with free DOX, HTM, and PHTM.
Abbreviations: CLSM, confocal laser scanning microscopy; DOX, doxorubicin; h, hours; HA, hyaluronic acid; HTM, HA-PHis/TPGS2k mixed micelles; pep-TPGS2k, Her2 peptide-modified TPGS2k; PHis, poly(L-histidine); PHTM, HA-PHis/pep-TPGS2k mixed micelles; TPGS2k, d-α-tocopheryl polyethylene glycol 2000.
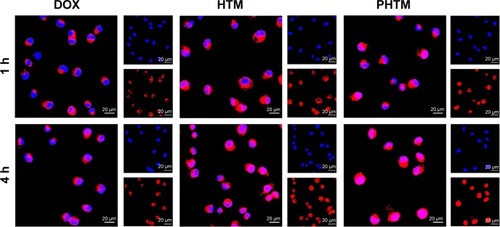
Figure 6 (A) In vitro viability of MDA-MB-231 cells treated with different inhibitors and (B and C) the effects of inhibitors on the uptake of PHTM in MDA-MB-231 cells.
Notes: Data expressed as mean ± standard deviation (n=3). *P<0.05.
Abbreviations: CC, colchicines; CPM, chlorpromazine; FLP, filipin; HA, hyaluronic acid; PHis, poly(L-histidine); pep, Her2 peptide; pep-TPGS2k, Her2 peptide-modified TPGS2k; PHTM, HA-PHis/pep-TPGS2k mixed micelles; TPGS2k, d-α-tocopheryl polyethylene glycol 2000.
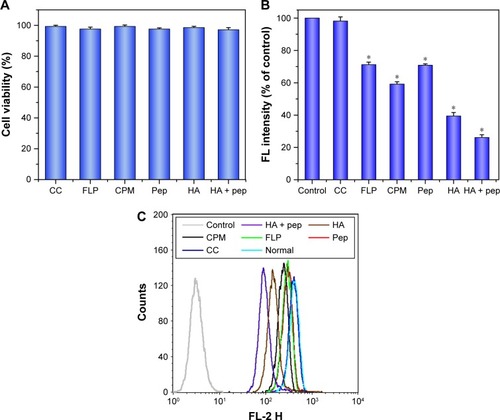
Figure 7 (A) In vivo noninvasive images of time-dependent whole body imaging of MDA-MB-231 tumor-bearing mice after injection of HTM and PHTM; (B) ex vivo optical images of tumors and organs; and (C) the fluorescence intensity in the tumor region of MDA-MB-231 tumor-bearing mice sacrificed at 48 h (n=3).
Note: *P<0.05.
Abbreviations: h, hours; HA, hyaluronic acid; HTM, HA-PHis/TPGS2k mixed micelles; PHis, poly(L-histidine); pep-TPGS2k, Her2 peptide-modified TPGS2k; PHTM, HA-PHis/pep-TPGS2k mixed micelles; TPGS2k, d-α-tocopheryl polyethylene glycol 2000.
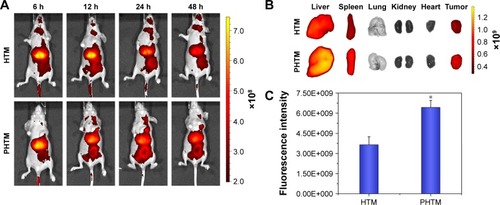
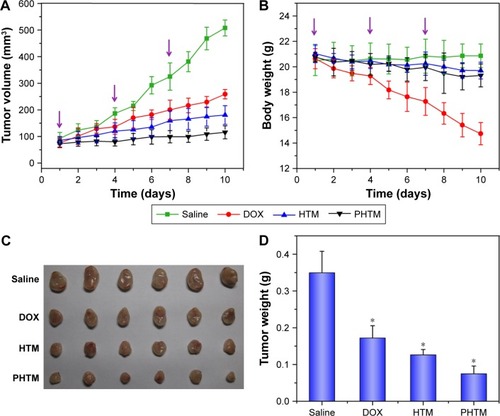
Figure 8 (A) The tumor volume and (B) body weight changes of saline, DOX solution, HTM, and PHTM on the MDA-MB-231 tumor-bearing mice; (C) the images of excised tumor tissues; and (D) the tumor weight of different formulation from MDA-MB-231 tumor-bearing mice at the time of sacrifice.
Notes: Data expressed as mean ± standard deviation (n=5). *P<0.05.
Abbreviations: DOX, doxorubicin; HA, hyaluronic acid; HTM, HA-PHis/TPGS2k mixed micelles; pep-TPGS2k, Her2 peptide-modified TPGS2k; PHis, poly(L-histidine); PHTM, HA-PHis/pep-TPGS2k mixed micelles; TPGS2k, d-α-tocopheryl polyethylene glycol 2000.