Figures & data
Table 1 Effect of PE-PEG and C300 on the loaded PTX concentration, mean particle size, and PI of resultant liposomes
Figure 1 Effect of C300 incorporation on the appearance and stability of PTX-loaded liposoems.
Notes: Effect of C300 incorporation on (A) the extent of foaming during liposomal preparation process and (B–D) time-dependent changes of (B) mean particle size, (C) PI, and (D) the loaded PTX concentration of PEGylated/saturated PC-based liposomes. Liposomes were prepared with 35:5:2 mixture of DMPC:CHOL:PE-PEG with or without incorporation of 2 mg of C300. Data are expressed as mean ± SD (n=3). Significant differences are indicated by *P<0.05; **P<0.005 compared to initial condition.
Abbreviations: C300, Captex 300; CHOL, cholesterol; DMPC, 1,2-dimyristoyl-sn-glycero-3-phosphocholine; PE-PEG, N-(Carbonyl-methoxypolyethyleneglycol 2000)-1, 2-distearoyl-sn-glycero-3-phosphoethanolamine; PI, polydispersity index; PTX, paclitaxel; SD, standard deviation.
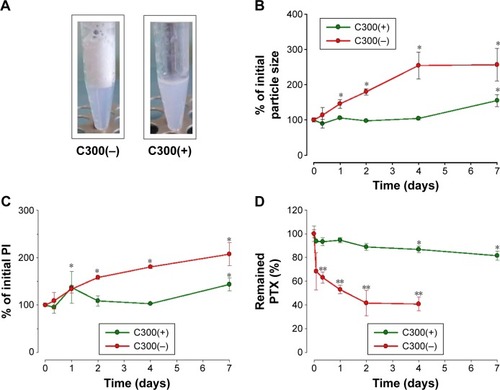
Figure 2 TEM analysis of PTX-loaded liposomes.
Notes: TEM images of (A–C) PTX-loaded/C300(−) DMPC:CHOL:PE-PEG liposomes prior to separating unloaded PTX (A), stored for 1 day at 4°C (B) and 7 days at 25°C (C), (D, E) PTX-loaded/C300(+) DMPC:CHOL:PE-PEG liposomes stored for 1 day at 4°C (D) and 7 days at 25°C (E). Rod-like PTX crystals and the fusion or aggregation of liposomes were indicated green and red arrow, respectively. TEM images in (C) were shown using both 100 (C1) and 200 nm (C2) scale for comparison.
Abbreviations: C300, Captex 300; CHOL, cholesterol; DMPC, 1,2-dimyristoyl-sn-glycero-3-phosphocholine; PE-PEG, N-(Carbonyl-methoxypolyethyleneglycol 2000)-1, 2-distearoyl-sn-glycero-3-phosphoethanolamine; PTX, paclitaxel; TEM, transmission electron microscopy.
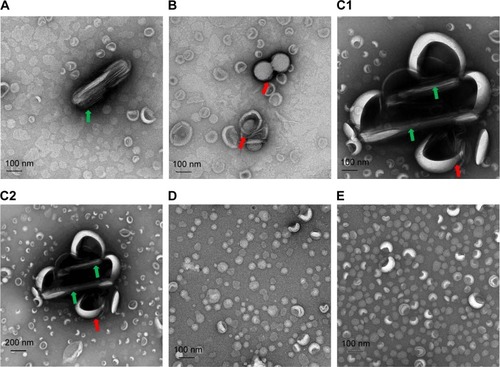
Figure 3 Effect of (A) oil type and (B) oil content on the time-dependent changes of loaded PTX concentration of liposomes.
Notes: Liposomes were prepared with 35:5:2 mixture of DMPC:CHOL:PE-PEG with or without incorporation of 2 mg of each oil (A) and indicated amount of C300 (B). Data are expressed as mean ± SD (n=3). Significant differences are indicated by *P<0.05; **P<0.005 compared to oil-free liposomes (A) and initial condition (B).
Abbreviations: C300, Captex 300; CHOL, cholesterol; DMPC, 1,2-dimyristoyl-sn-glycero-3-phosphocholine; PE-PEG, N-(Carbonyl-methoxypolyethyleneglycol 2000)-1, 2-distearoyl-sn-glycero-3-phosphoethanolamine; PI, polydispersity index; PTX, paclitaxel; SD, standard deviation.
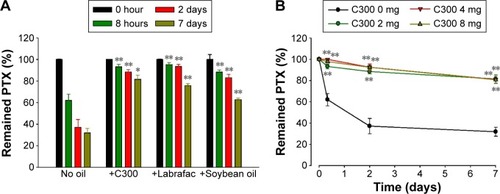
Figure 4 Effect of C300 on the time-dependent changes of (A) mean particle size and the remained PTX concentration (B) of unsaturated PC-based liposomes.
Notes: DOPC:CHOL:PE-PEG or SoyPC:CHOL:PE-PEG liposomes prepared with or without C300 (2 mg per 42 μmole lipid) were stored at 25°C for indicated period. Each point represents the mean ± SD (n=3). Significant differences are indicated by *P<0.05; **P<0.005 compared to initial condition.
Abbreviations: C300(−), Captex 300-free liposomes; C300(+), Captex 300-incorporated liposomes; CHOL, cholesterol; DOPC, 1,2-dioleoyl-sn-glycero-3-phosphocholine; PC, phosphatidylcholine; PE-PEG, N-(Carbonyl-methoxypolyethyleneglycol 2000)-1, 2-distearoyl-sn-glycero-3-phosphoethanolamine; PTX, paclitaxel; SoyPC, soy-l-α-phosphatidylcholine; SD, standard deviation.
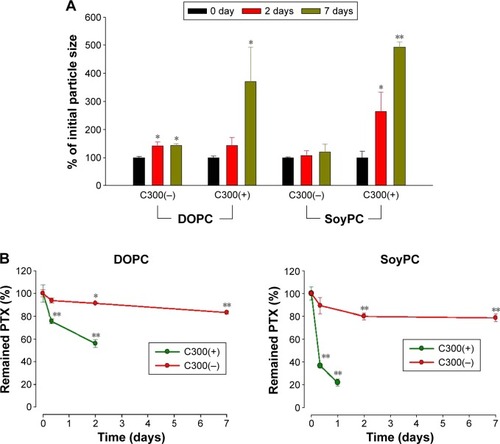
Figure 5 Long-term stability of triglyceride-incorporated/saturated PC-based liposomes.
Notes: Long-term stability of triglyceride-incorporated/saturated PC-based liposomes assessed as changes in mean droplet size (A), PI (B), and remained PTX concentration (C) of liposomes. *P<0.05; **P<0.005 compared to initial condition. (D) Effects of triglyceride incorporation on the remained PTX in freeze-dried liposomes. PTX-loaded liposomes were prepared with a 7:1:0.4 of DMPC:CHOL:PE-PEG mixture with or without C300 (2 mg per 42 μmole lipid). Each point represents the mean ± SD (n=3).
Abbreviations: C300(−), Captex 300-free liposomes; C300(+), Captex 300-incorporated liposomes; CHOL, cholesterol; DMPC, 1,2-dimyristoyl-sn-glycero-3-phosphocholine; PE-PEG, N-(Carbonyl-methoxypolyethyleneglycol 2000)-1, 2-distearoyl-sn-glycero-3-phosphoethanolamine; PTX, paclitaxel; SD, standard deviation; PI, polydispersity index.
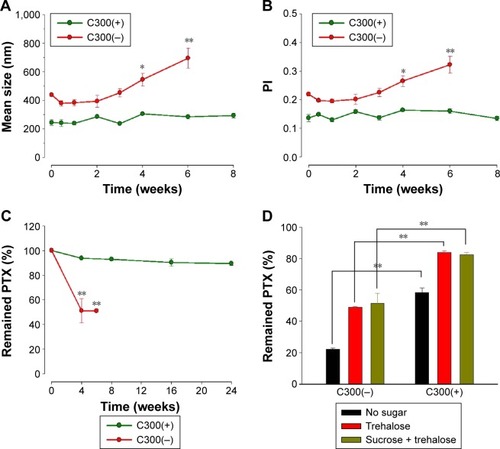
Figure 6 Release profile and in vitro anticancer efficacy of varying PTX formulations.
Notes: (A) Comparison of PTX release profile between liposomal formulation and Taxol®. (B) Evaluation of anticancer efficacy of liposomal formulation in comparison with Taxol. Human H460 lung cancer cells treated with varying concentrations of PTX-loaded C300(+) liposomes or Taxol for 48 hours were subjected to MTT assay. (C) Comparison of antiproliferative effects assessed by colony formation assay. Mouse B16-F10 melanoma cells were treated for 8 days with different concentrations of PTX-loaded C300(+) liposomes or Taxol. The number of colonies in the dish treated with saline was used as an index for a 100% (control) and this value was used to obtain the percentage colony numbers for other dishes. Left panel is the representative dishes following crystal violet staining of cell colonies treated with liposomal formulation (n=4, *P<0.05, **P<0.005 compared to Taxol). PTX-loaded liposomes were prepared with a 7:1:0.4 of DMPC:CHOL:PE-PEG mixture with C300 (2 mg per 42 μmole lipid).
Abbreviations: C300(−), Captex 300-free liposomes; C300(+), Captex 300-incorporated liposomes; CHOL, cholesterol; CTL, control; DMPC, 1,2-dimyristoyl-sn-glycero-3-phosphocholine; empty C300(+), paclitaxel-free/Captex 300-incorporated liposomes; MTT, 3-(4,5-dimethylthiazol-2-yl)-2,5-diphenyltetrazolium bromide; PE-PEG, N-(Carbonyl-methoxypolyethyleneglycol 2000)-1, 2-distearoyl-sn-glycero-3-phosphoethanolamine; PTX, paclitaxel; SD, standard deviation.
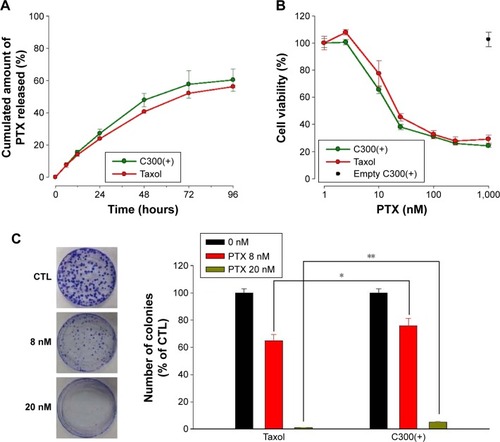
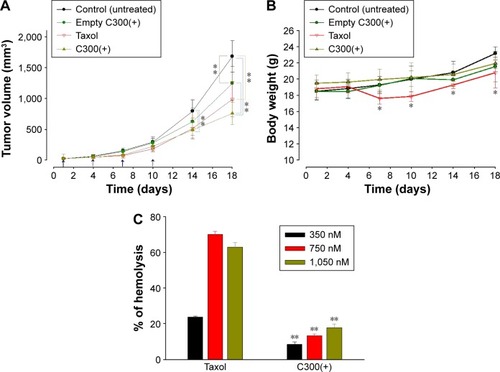
Figure 7 In vivo anticancer activity and hemolytic toxicity of PTX formulations.
Notes: (A) Anticancer activity of C300(+) liposomes in comparison with Taxol. Tumor volume changes were determined after injection of formulations into the tail vein of each mouse (n=6–7), **P<0.005. The upward arrow represents administration time points. (B) Body weight changes of SCC7 tumor-bearing mice after injection. *P<0.05 compared to control. (C) Comparison of hemolytic toxicity of Taxol® and liposomal PTX formulation (n=3). **P<0.005 compared to Taxol. PTX-loaded liposomes were prepared with a 7:1:0.4 of DMPC:CHOL:PE-PEG mixture with C300 (2 mg per 42 μmole lipid).
Abbreviations: C300(+), Captex 300-incorporated liposomes; CHOL, cholesterol; DMPC, 1,2-dimyristoyl-sn-glycero-3-phosphocholine; PE-PEG, N-(Carbonyl-methoxypolyethyleneglycol 2000)-1, 2-distearoyl-sn-glycero-3-phosphoethanolamine; PTX, paclitaxel; SD, standard deviation.