Figures & data
Figure 1 Massive vacuolization of GFP-LC3/HeLa cells induced by Y2O3, Yb2O3 but not La2O3. A) Direct observation of vacuolization and GFP-LC3 dot aggregation via fluorescent microscopy (treated with 50 μg/mL oxide particles, 24 h). B) The vacuoles in GFP-LC3/HeLa cells treated with Yb2O3 (50 μg/mL, 24 h). C) GFP-LC3 aggregation dose effect after treatment with Yb2O3 for 24 h. D) GFP-LC3 aggregation time curve after treatment with 50 μg/mL Yb2O3. E) Vacuolization percentage dose effect in GFP-LC3/HeLa cells after treatment with Yb2O3 for 24 h. F) Vacuolization percentage time curve essay after treatment with 100 μg/mL Yb2O3. Mean ± SEM; n = 3.
Notes: *P < 0.05; **P < 0.01.
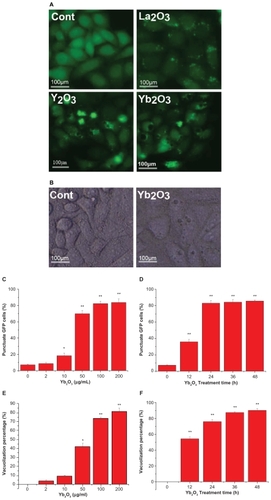
Figure 2 The vacuolization of GFP-LC3/HeLa cells, induced by Y2O3, Yb2O3, is coupled with a typical autophagic process. A) Ultrastructural features of autophagosomes treated with PBS or 50 μg/mL of Yb2O3 for 2 days, as revealed by TEM. Right panels are high magnification images of left panels. Typical AVs (black arrows) are indicated, b–d. Autophagic marker dye staining assay on GFP-LC3/HeLa cells treated with 50 μg/mL Yb2O3 for 24 h. B) 10MM MDC, 15 min. C) 75 nM LysoTracker Red (LT), 15 min. D) 20 nM MitoTracker Red (MT), 15 min. Hoechst 33342 (HO) dye was used to show nucleus subcellular location. E) LC3 protein type conversion and the accumulation of LC3-ll in 48 h, Cells were treated with 50 μg/mL Yb2O3 and then subject to the western blotting. GAPDH was loading control. F) P62 protein degradation rate in autophagy pathway was measured by western blotting. Cells were treated with 50 μg/mL Yb2O3 for 24 h and then analyzed. GAPDH was loading control.
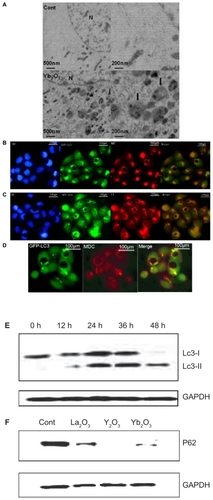
Figure 3 The size-dependent effect of vacuolization induced by Y2O3. A) GFP-LC3/HeLa cell lines treated with Y2O3 nanoparticles no longer contain visible vacuoles. B, C) DLS and TEM picture showed smaller size of nano-Y2O3 powder. D, E, F) The supernatant of Y2O3 after centrifugation at 1600 rpm also showed similar results.
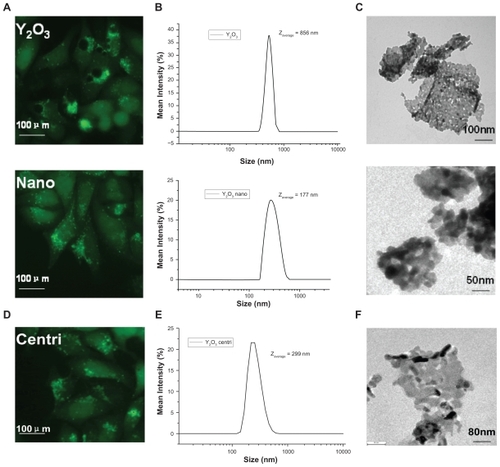
Figure 4 The size-dependent effect of vacuolization induced by Yb2O3. A) sonicated Yb2O3 no longer causes visible vacuoles in GFP-LC3/HeLa cell lines. B, C) DLS data and TEM picture showed smaller size of sonicated Yb2O3 compared to untreated Yb2O3 particles. D) Autophagic marker dye staining assay on GFP-LC3/HeLa cells treated with 50 μg/mL Yb2O3 (sonicated) for 24 h. E) LC3 protein type conversion. Cells were either untreated (cont) or treated with 50 μg/mL oxide particles for 24 h and collected for western blotting.
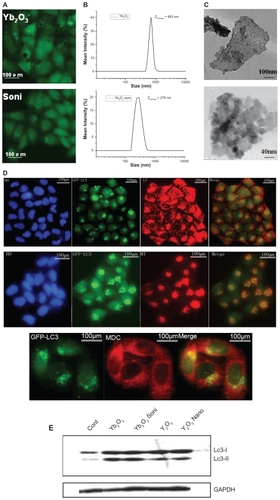
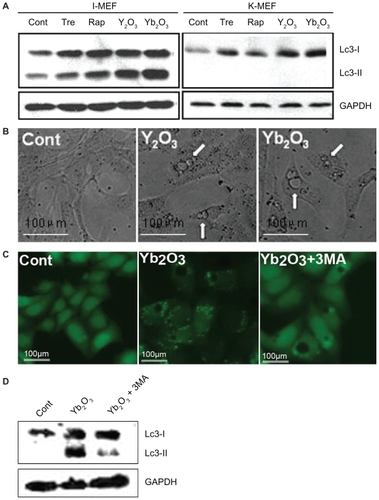
Figure 5 Massive vacuolization induced by Y2O3, Yb2O3 is an independent event. A) the autophagy blocking effect of Atg5−/− MEF cells by western blotting. Cells were either untreated (cont) or treated with trehalose 100 μM, rapamycin 50 μg/mL (Tre, Rap, two well-known autophagy inducers as positive control), 50 μg/mL Y2O3, Yb2O3, I-MEF = immortalized wildtype MEF cells, K-MEF = Atg5−/− MEF cells. B) Direct vacuolization of K-MEF cells observed under phase contrast microscopy. C, D) 3-MA, the autophagy inducer, does not interfere with vacuolization. Cells were treated with nothing (cont), 50 μg/mL Yb2O3, 50 g/mL Yb2O3 + 5 μM 3-MA. After observation under fluorescent microscopy, cells were trypsinized, collected and subject to western blotting.