Figures & data
Figure 1 A) Photomicrographs of silver nanoparticles (NPs). B) Transmission electron microscopic image of bulk of silver NPs. Bars in A) and B) indicate 20 nm and 5 nm, respectively.
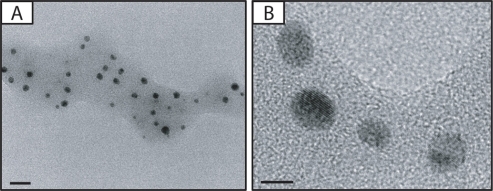
Table 1 Effect of inhalation exposure to silver NPs on hematologic profiles
Table 2 Effect of inhalation exposure to silver NPs on serum chemistry profiles
Figure 2 Effect of silver nanoparticles (NPs) on intracellular reactive oxygen species (ROS) levels in bronchoalveolar lavage (BAL) cells from ovalbumin (OVA)-sensitized and OVA-challenged mice. Sampling was performed 72 hours after the final challenge. A–D) Representative microphotographs show the dichlorofluorescein (DCF) fluorescence intensity of cells from saline-inhaled mice administered saline A), OVA-inhaled mice administered saline B), saline-inhaled mice administered 40 mg/kg of silver NPs (C), and OVA-inhaled mice administered 40 mg/kg of silver NPs D). E–H) Corresponding transmission light microphotographs are shown. I–L) A representative frequency histogram of the fluorescence intensity of cells from saline-inhaled mice administered saline (SAL), OVA-inhaled mice administered saline (OVA), saline-inhaled mice administered 40 mg/kg of silver NPs (Ag 40), and OVA-inhaled mice administered 40 mg/kg of silver NPs (OVA + Ag 40).
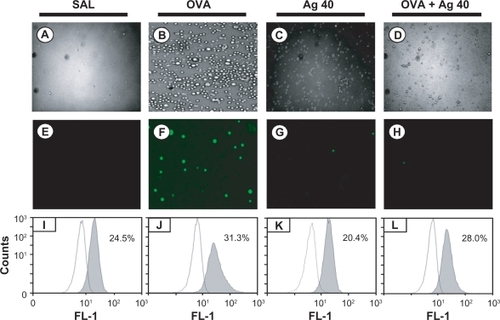
Figure 3 Effect of silver nanoparticles (NPs) on the protein expression of NF-κB p65 in lung tissues collected from ovalbumin (OVA)-sensitized and OVA-challenged mice. NF-κB p65 were measured 72 hours after the final challenge in saline-inhaled mice administered saline (SAL), OVA-inhaled mice administered saline (OVA), saline-inhaled mice administered 40 mg/kg of silver NPs (Ag 40), and OVA-inhaled mice administered 40 mg/kg of silver NPs (OVA + Ag 40). A) Western blot analyses of NF-κB p65 in nuclear (Nuc) and cytosolic (Cyt) protein extracts from lung tissues. B) NF-κB p65 protein levels in (A) were quantified using a Gel-Pro Analyzer (Media Cybernetics, Silver Spring, MD, USA) and plotted as the integrated optical density, using Microsoft Excel. Bars indicate the mean ± SEM and are representative of eight independent experiments using different preparations of nuclear and cytosolic extracts. *P < 0.05 versus SAL; #P < 0.05 versus OVA.
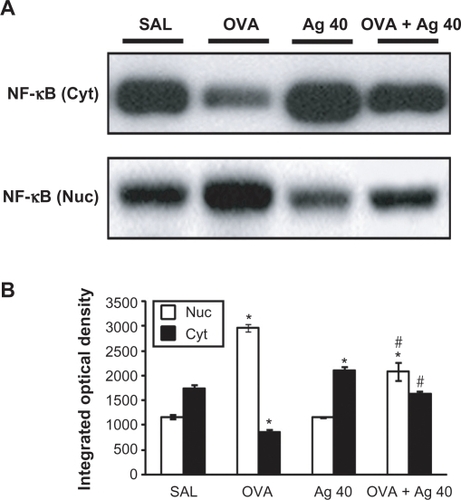
Figure 4 Effect of silver nanoparticles (NPs) on IL-4, IL-5, and IL-13 expression in lung tissues collected from ovalbumin (OVA)-sensitized and OVA-challenged mice. Sampling was performed 72 hours after the final challenge in saline-inhaled mice administered saline (SAL), OVA-inhaled mice administered saline (OVA), saline-inhaled mice administered 40 mg/kg of silver NPs (Ag 40), and OVA-inhaled mice administered 40 mg/kg of silver NPs (OVA + Ag 40). A) RT-PCR results. B) Western blot analyses of IL-4, IL-5, and IL-13 in lung tissues. C) Quantification of the IL-4, IL-5, and IL-13 protein levels in B) using Gel-Pro Analyzer (Media Cybernetics, Silver Spring, MD, USA). The relative protein content was calculated as the ratio of the integrated optical density of each protein to that of actin. The ratio is arbitrarily presented as 100%. Bars indicate the mean ± SEM and are representative of eight independent experiments using different preparations of lung tissues. *P < 0.05 versus SAL; #P < 0.05 versus OVA.
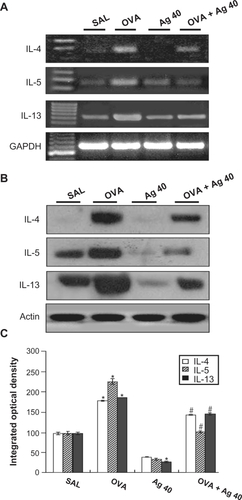
Figure 5 Effect of silver nanoparticles (NPs) on bronchial inflammation in ovalbumin (OVA)-sensitized and OVA-challenged mice. Sampling was performed 72 hours after the final challenge in saline-inhaled mice administered saline (SAL), OVA-inhaled mice administered saline (OVA), saline-inhaled mice administered 40 mg/kg of silver NPs (Ag 40), and OVA-inhaled mice administered 40 mg/kg of silver NPs (OVA + Ag 40). A−D) Representative H&E-stained sections of the lungs. Bars indicate scale of 50 μm. E) Total lung inflammation scores. F) The numbers of total and differential cellular components of bronchoalveolar lavage (BAL) fluids. Bars indicate the mean ± SEM for eight mice per group in four to six independent experiments. *P < 0.05 versus SAL; #P < 0.05 versus OVA.
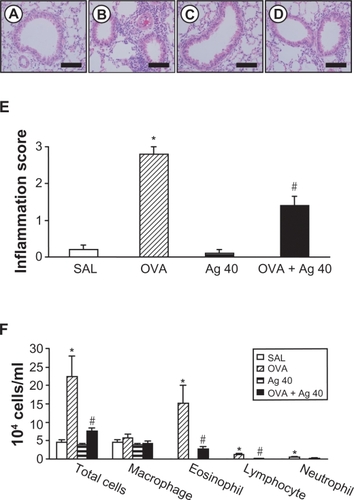
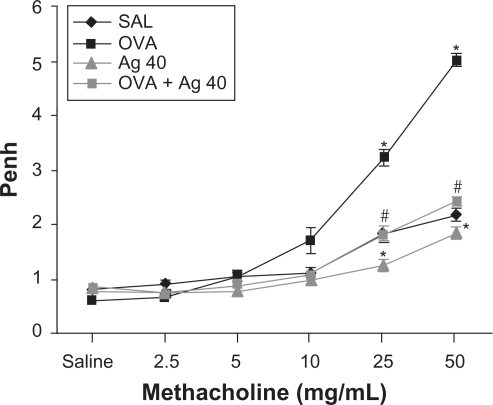
Figure 6 Effect of silver nanoparticles (NPs) on airway responsiveness to inhaled methacholine in ovalbumin (OVA)-sensitized and OVA-challenged mice. Airway hyperresponsiveness was measured at 48 h after the final challenge in saline-inhaled mice administered saline (SAL), OVA-inhaled mice administered saline (OVA), saline-inhaled mice administered 40 mg/kg of silver NPs (Ag 40), and OVA-inhaled mice administered 40 mg/kg of silver NPs (OVA + Ag 40). Penh values were obtained in response to increasing doses (2.5–50 mg/mL) of methacholine. Bars indicate the mean ± SEM for eight mice per group in four to six independent experiments. *P < 0.05 versus SAL; #P < 0.05 versus OVA.