Figures & data
Figure 1 Transmission electron microscopic image obtained from purified fractions collected after sucrose density gradient of silver nanoparticles synthesized using Bacillus licheniformis. Purified nanoparticles from B. licheniformis were examined by electron microscopy.Citation27,Citation28 Several fields were photographed and were used to determine the diameter of nanoparticles. The range of observed diameter was 50 nm.
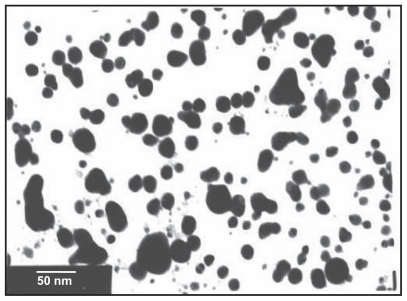
Figure 2 Dose-dependent effect of silver nanoparticles over cell viability using MTT assay. Results are presented in relative units compared with controls. Data represent the mean ± standard error of the mean of three individual experiments. P < 0.05 compared with the control group.
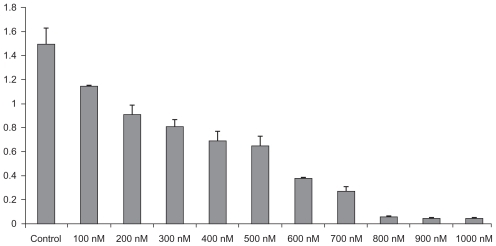
Figure 3 Silver nanoparticles induce apoptosis in Dalton’s lymphoma ascites cells by caspase 3 activation.
*P < 0.05 versus controls, data were mean ± standard deviation calculated from three individual experiments (n = 3; *P < 0.01, **P < 0.001, ***P < 0.0001).
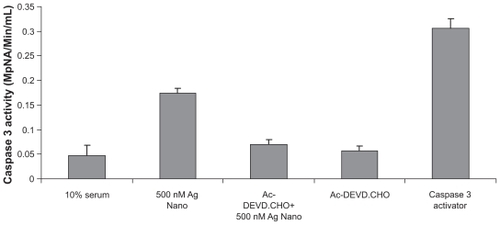
Figure 4 DNA fragmentation assay. Lane 1 (1 kb ladder), lane 2 (10% serum), and lane 3 (treated with silver nanoparticles).
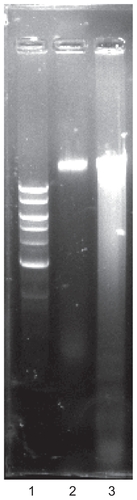
Table 1 Effect of silver nanoparticles on survival rate in DLA tumor-bearing mice
Figure 5 Histologic analysis of ascitic cells in animal models. A) Smear showing numerous clumps of pleomorphic cells with hyperchromatic nuclei that are malignant cell clumps (tumor controls). B and C) Smears show very few pleomorphic cells with hyperchromatic nuclei and significant reduction in malignant cell clumps in comparison with A (tumor, treated group).
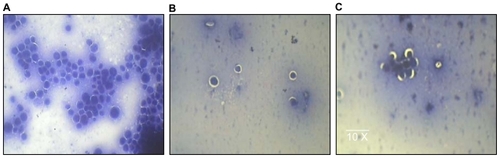
Figure 6 Antitumor activity of silver nanoparticles in a Dalton’s lymphoma ascites mice model. A significant reduction in body weight and tumor volume in the peritoneal region following treatment with silver nanoparticles in comparison with controls. Key: A) tumor control; B) tumor mice treated with silver nanoparticles for 15 days.
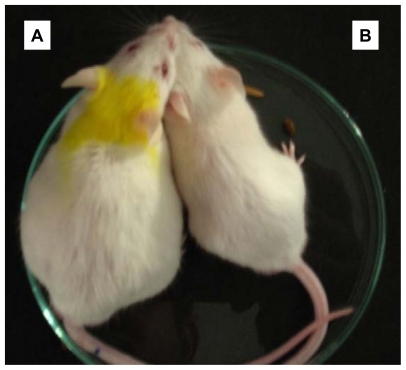
Table 2 Effect of silver nanoparticles on ascitic tumor volume and body weight
Table 3 Effect on silver nanoparticles on hematologic parameters