
Figures & data
Figure 1 Synthesis of NDCONH(CH2)2NH-VDGR/survivin-siRNA. Conditions in each step: (i) H2SO4/HNO3; (ii) SOCl2; (iii) NH2(CH2)2NH-Boc/THF and HCl/EA; and (iv) EDC/Boc-Arg(Tos)-Gly-Asp(OMe)-Val-OH, NaOH/MeOH, and TFA/TfOH.
Abbreviations: siRNA, small interfering RNA; THF, tetrahydrofuran; EA, ethyl alcohol; EDC, N1-((ethylimino)methylene)-N3,N3-dimethylpropane-1,3-diamine; TFA, trifluoroacetic acid; TfOH, trifluoromethanesulfonic acid; ND, nanodiamond.
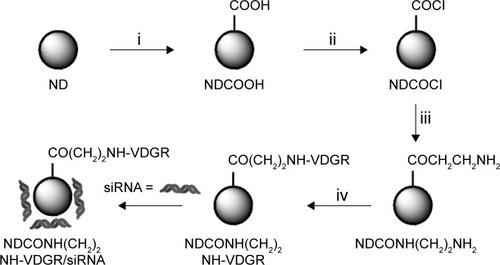
Figure 2 FT-IR spectra of ND, NDCO2H, NDCOCl, NDCONH(CH2)2NH2, and NDCONH(CH2)2NH-VDGR.
Abbreviations: FT-IR, Fourier transform infrared; ND, nanodiamond.
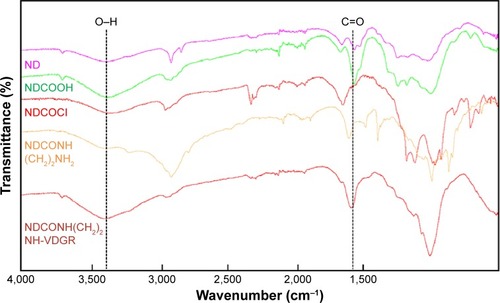
Figure 3 TEM images of ND (A), NDCONH(CH2)2NH-VDGR (B), and NDCONH(CH2)2NH-VDGR/survivin-siRNA (C).
Abbreviations: TEM, transmission electron microscopy; ND, nanodiamond; siRNA, small interfering RNA.
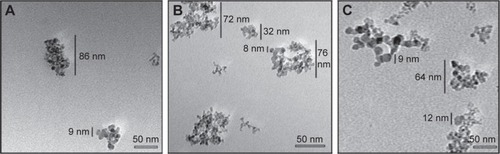
Figure 4 SEM images of ND (A), NDCONH(CH2)2NH-VDGR (B), and NDCONH(CH2)2NH-VDGR/survivin-siRNA (C).
Abbreviations: SEM, scanning electron microscopy; ND, nanodiamond; siRNA, small interfering RNA.
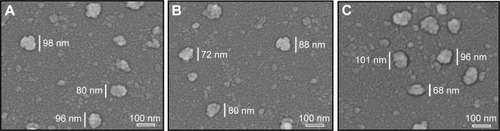
Figure 5 AFM images of mouse plasma alone (A), ND in mouse plasma (B), NDCONH(CH2)2NH-VDGR in mouse plasma (C), and NDCONH(CH2)2NH-VDGR/survivin-siRNA in mouse plasma (D).
Abbreviations: AFM, atomic force microscopy; ND, nanodiamond; siRNA, small interfering RNA.
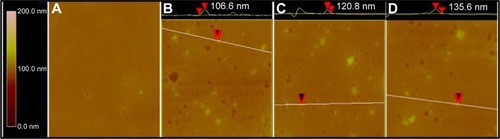
Figure 6 Particle size and PDI of ND (A) and NDCONH(CH2)2NH-VDGR (B), and NDCONH(CH2)2NH-VDGR/survivin-siRNA (C).
Abbreviations: PDI, polydispersity index; ND, nanodiamond; siRNA, small interfering RNA.
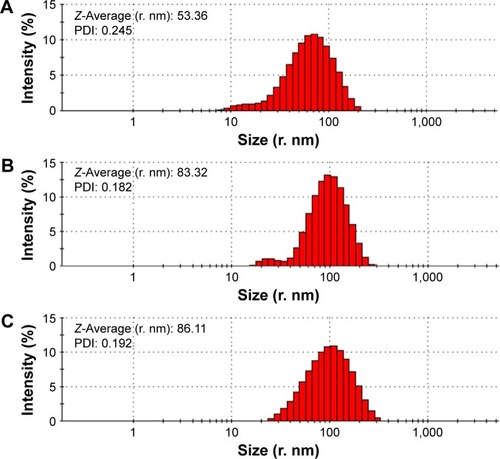
Figure 7 Tyndall effect of ND (B) and NDCONH(CH2)2NH-VDGR (C). Water (A) served as control. The zeta potential of ND (D), NDCONH(CH2)2NH-VDGR (E), and NDCONH(CH2)2NH-VDGR/survivin-siRNA (F).
Abbreviations: ND, nanodiamond; siRNA, small interfering RNA.
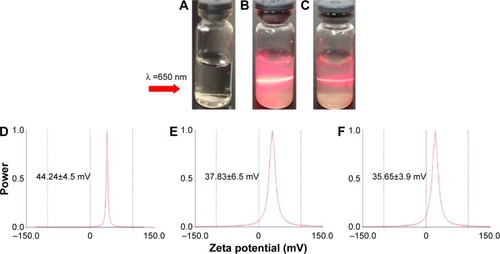
Figure 8 Agarose gel retardation of naked survivin-siRNA and NDCONH(CH2)2NH-VDGR/survivin-siRNA at different N/P ratios.
Abbreviations: siRNA, small interfering RNA; N, negative; P, positive.
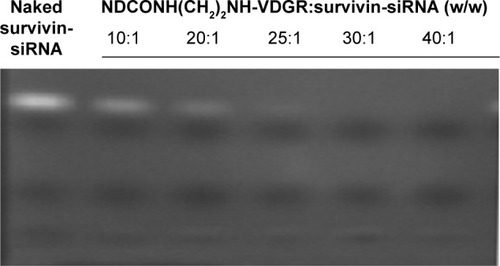
Figure 9 The DSC curves of NDCONH(CH2)2NH-VDGR and different concentrations of NDCONH(CH2)2NH-VDGR/survivin-siRNA.
Abbreviations: DSC, differential scanning calorimetry; siRNA, small interfering RNA.
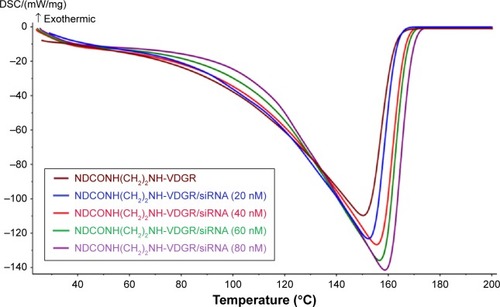
Figure 10 The cumulative releasing percentage of survivin-siRNA from NDCONH(CH2)2NH-VDGR/survivin-siRNA, ND/survivin-siRNA, and naked survivin-siRNA in TE buffer (n=3).
Abbreviations: siRNA, small interfering RNA; ND, nanodiamond; TE, Tris–ethylene diamine tetraacetic acid.
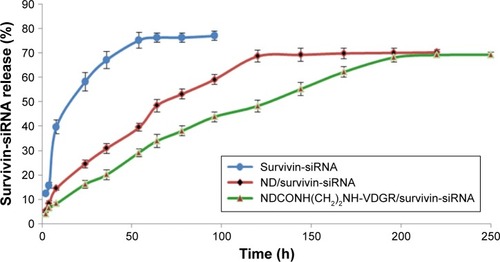
Figure 11 Confocal images of control (A), cells treated with naked FAM-survivin-siRNA (B), and cells treated with NDCONH(CH2)2NH-VDGR/FAM-survivin-siRNA (C).
Abbreviation: siRNA, small interfering RNA.
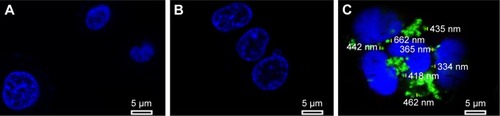
Figure 12 Cytotoxicity assay using MTT method. Data are presented as the average ± SD (n=3).
Abbreviations: MTT, 3-(4,5-dimethylthiazol-2-yl)-2,5-diphenyltetrazolium bromide; SD, standard deviation.
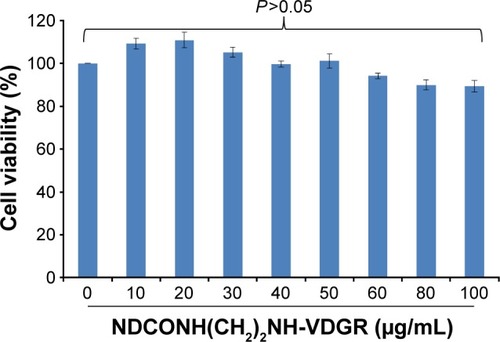
Figure 13 Viability of MCF-7 cells after treatment with different concentrations of NDCONH(CH2)2NH-VDGR, survivin-siRNA, NDCONH(CH2)2NH-VDGR/NC, NDCONH(CH2)2NH-VDGR/survivin-siRNA, Lipo/NC, and Lipo/survivin-siRNA for 48 h. Data are presented as the average ± SD (n=3).
Abbreviations: siRNA, small interfering RNA; NC, normal control; SD, standard deviation.
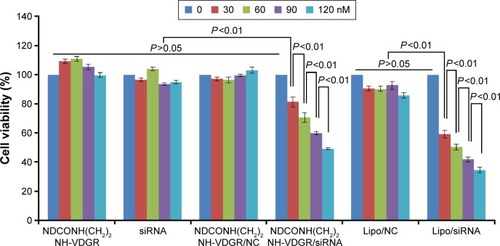
Figure 14 Antiproliferation effect of NDCONH(CH2)2NH-VDGR/survivin-siRNA against MCF-7 cells at different concentrations. Data are presented as the average ± SD (n=3).
Abbreviations: siRNA, small interfering RNA; SD, standard deviation.
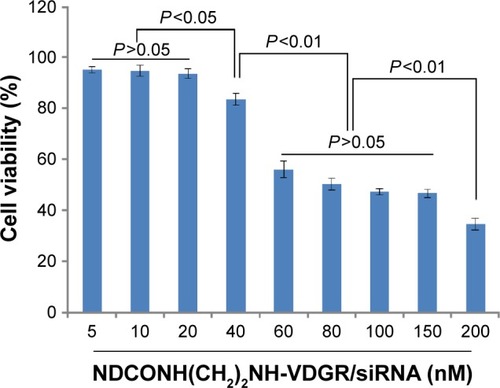
Figure 15 The apoptosis of MCF-7 cells induced by survivin-siRNA (B), NDCONH(CH2)2-NH-VDGR (C), and NDCONH(CH2)2NH-VDGR/survivin-siRNA (D). Cells treated with PBS solution served as control (A) (n=3).
Abbreviations: siRNA, small interfering RNA; PBS, phosphate-buffered saline; FITC-A, fluorescein isothiocyanate–Annexin V; PI-A, propidium iodide–Annexin V.
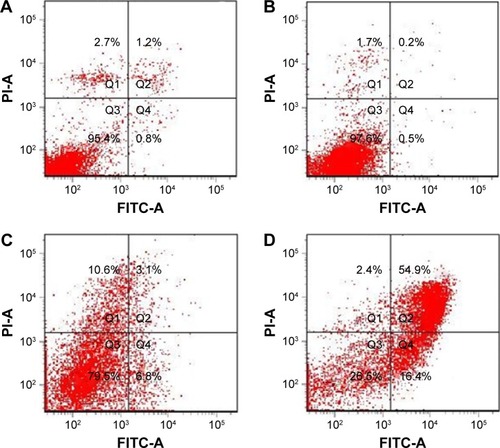
Figure 16 The cell percentage of blank, naked survivin-siRNA, NDCONH(CH2)2NH-VDGR/survivin-siRNA, and Lipo/survivin-siRNA group in each period of cell cycle (n=3).
Abbreviation: siRNA, small interfering RNA.
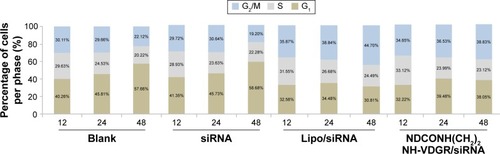
Figure 17 Survivin-mRNA expression of MCF-7 cells treated with NDCONH(CH2)2NH-VDGR/survivin-siRNA. Data are presented as the average ± SD (n=3).
Abbreviations: siRNA, small interfering RNA; SD, standard deviation; NC, normal control.
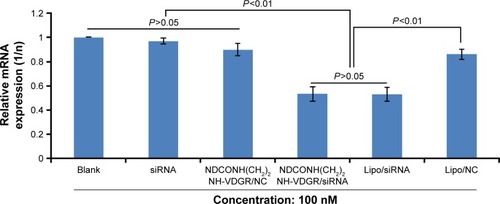
Figure 18 Survivin protein expression of MCF-7 cells treated with NDCONH(CH2)2NH-VDGR/survivin-siRNA. Data are presented as the average ± SD (n=3).
Abbreviations: siRNA, small interfering RNA; SD, standard deviation; ELISA, enzyme-linked immunosorbent assay; NC, normal control.
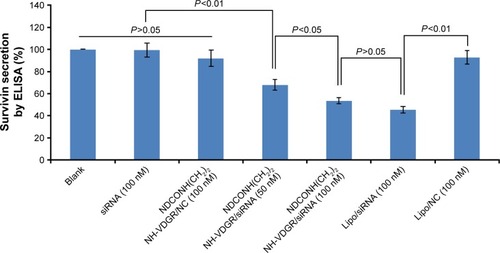
Figure 19 Tumor weights of the normal control (NS), survivin-siRNA group, NDCONH(CH2)2NH-VDGR/survivin-siRNA group, and DOX group (n=10).
Abbreviations: siRNA, small interfering RNA; DOX, doxorubicin; SD, standard deviation.
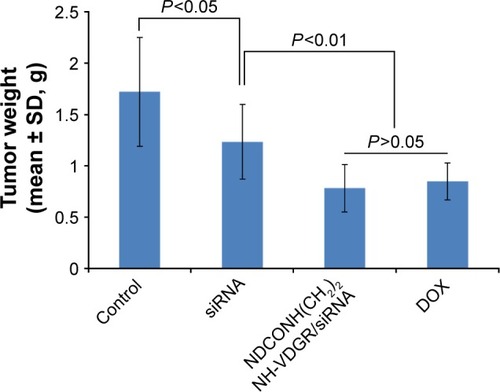
Figure 20 Tumor tissues from normal control (NS) group (A), survivin-siRNA group (B), NDCONH(CH2)2NH-VDGR/survivin-siRNA group (C) and DOX group (D).
Abbreviations: siRNA, small interfering RNA; DOX, doxorubicin.
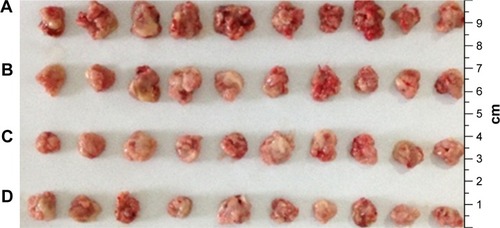
Figure 21 MS spectra of organ homogenate in NDCONH(CH2)2NH-VDGR/survivin-siRNA group. RGDV (m/z): 444.22012 [M-H]−.
Abbreviations: MS, mass spectrometry; siRNA, small interfering RNA.
![Figure 21 MS spectra of organ homogenate in NDCONH(CH2)2NH-VDGR/survivin-siRNA group. RGDV (m/z): 444.22012 [M-H]−.Abbreviations: MS, mass spectrometry; siRNA, small interfering RNA.](/cms/asset/c0d71321-84f8-405c-b282-f118fa8a9479/dijn_a_117611_f0021_b.jpg)