Figures & data
Figure 1 A schematic description of the algorithm for reconstructing µs′.
Notes: After running T iterations of multi-plane G–S algorithm, the estimated phase
is retrieved. The calculated phase’s STD together with the tissue thickness, Z, produces an estimation for µs′ using a look up table (that was built as described above).
Abbreviations: G–S algorithm, Gerchberg-Saxton algorithm; STD, standard deviation.
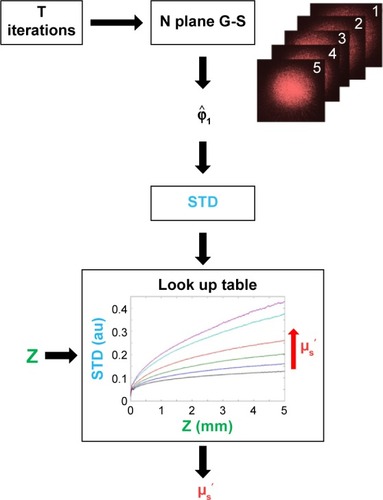
Figure 2 The experimental setup for recording light intensity images.
Notes: (A) A schematic image of the setup. (B) An image of the setup and its components in the lab. The camera records images at multiple planes with equal intervals between them. The experimental setup was designed for reflection measurements. The light source is a helium neon (He-Ne) gas laser with λ=632.8 nm, the focal length of the reflection lens is 75 mm; polarizers were added for optical clearing purposes. The sample is set on 3 axis micrometer plates and can be adjusted in the x-y-z directions.
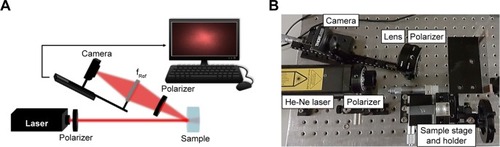
Figure 3 The synthesized PEGylated GNRs.
Notes: (A) TEM image of the GNRs. (B) The absorption spectrum of the GNRs, presenting a strong peak at 645 nm.
Abbreviations: PEG, polyethylene glycol; GNRs, gold nanorods; TEM, transmission electron microscopy; au, arbitrary units.
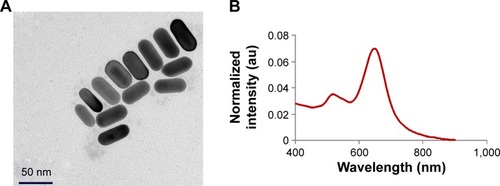
Figure 4 The experimental setup during in vivo measurements.
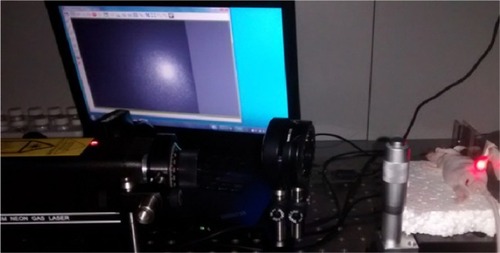
Figure 5 The STD obtained for ex vivo experiments.
Notes: The experiments were conducted on two groups: 1) two ears were measured on the same day as sacrifice, ie, day 0; 2) two ears were measured 6 days following sacrifice, ie, day 6. Following control (orange bars) measurements, 5 µL of 2 mM MB was applied to the ears and reflection signals were measured again 24 h later (blue bars). The algorithm parameters were: 8 recorded images (64 iterations) with 1.27 mm distance between them. (*P<0.05, ***P<0.001).
Abbreviations: STD, standard deviation; MB, Methylene blue; au, arbitrary units.
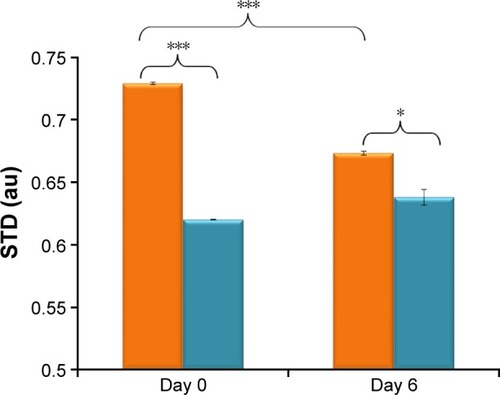
Figure 6 Femoral vein and adjacent tissues effect on the light phase using GNRs.
Notes: (A) The experimental setup during in vivo experiments. The mouse was laid on a flat surface with its inner thigh facing the laser. It was set on the sample holder on a 3 axis micrometer stage which enables fine-tuning during experiments. The center of the light beam was directed exactly to the femoral vein. (B) The obtained STD in the in vivo measurements. The mouse’s femoral vein (red bars) and tissues in its environment (green) were irradiated following GNRs injection (0.25 h and 24 h postinjection). The algorithm parameters were: 9 recorded images (81 iterations) with 1.27 mm distance between them. (*P<0.05, ***P<0.001).
Abbreviations: GNRs, gold nanorods; STD, standard deviation.
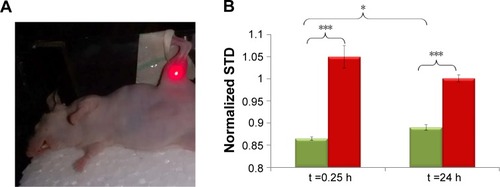
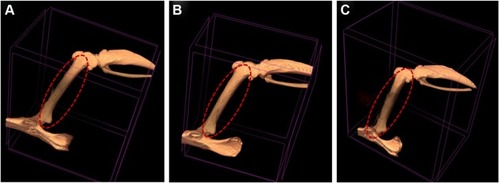
Figure 7 CT images of the femoral vein and its environment pre- and post-GNRs injection.
Notes: (A) Pre-GNRs injection; (B) 4 h post-GNRs injection; (C) 8 days post-GNRs injection. No differences can be observed between the three images.
Abbreviations: CT, computed tomography; GNRs, gold nanorods.