Figures & data
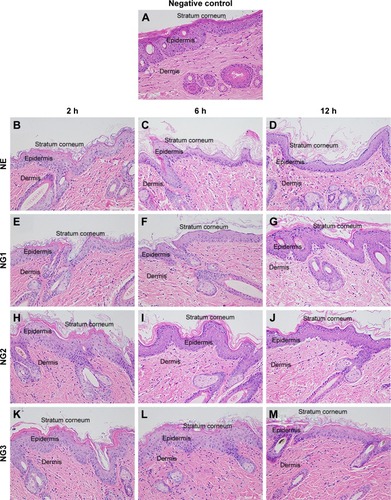
Figure 1 Pseudoternary phase diagrams of four cosurfactants combined with EL-40 at fixed mass ratio (1:1).
Notes: (A) 1,2-Propylene glycol; (B) glycerin; (C) ethanol; and (D) n-butyl alcohol.
Abbreviations: EL-40, Cremophor EL-40; Smix, mix of surfactant and cosurfactant.
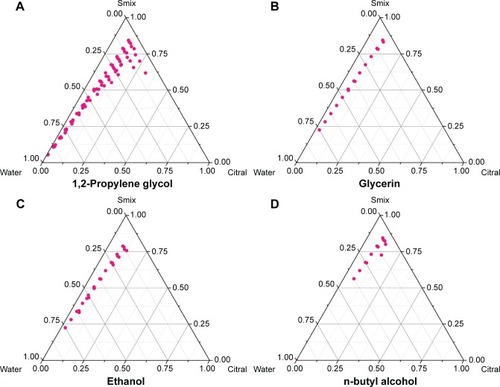
Figure 2 Pseudoternary phase diagrams of various Km ratios of EL-40 and 1,2-propylene glycol.
Notes: (A) Km: 1:0; (B) Km: 1:2; (C) Km: 1:3; (D) Km: 2:1; (E) Km: 3:1; and (F) Km: 4:1.
Abbreviations: EL-40, Cremophor EL-40; Km, surfactant–cosurfactant; Smix, mix of surfactant and cosurfactant.
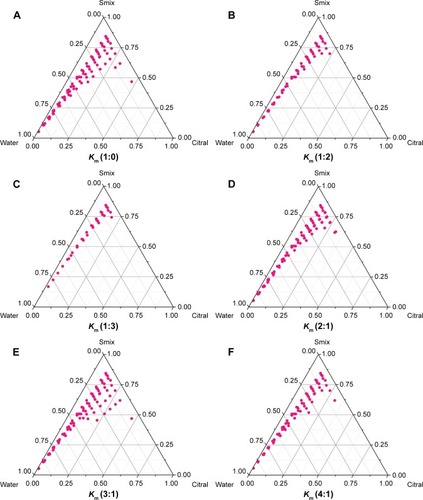
Figure 3 Droplet size distribution immediately after production.
Notes: (A) NE; (B) NG1; (C) NG2; and (D) NG3. NG1, NG2, NG3: NE gels containing 1%, 2%, and 3% (w/w) Carbopol® 934, respectively.
Abbreviations: d, diameter; NE, nanoemulsion; NG, NE gel.
Figure 4 Zeta potential diagrams.
Notes: (A) NE; (B) NG1; (C) NG2; (D) NG3. NG1, NG2, NG3: NE gels containing 1, 2, and 3% (w/w) Carbopol® 934, respectively.
Abbreviations: NE, nanoemulsion; NG, NE gel.
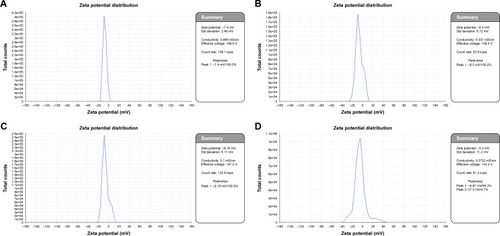
Figure 5 TEM images of the formulations.
Notes: (A) NE; (B) NG1; (C) NG2; (D) NG3. NG1, NG2, NG3: NE gels containing 1%, 2%, and 3% (w/w) Carbopol® 934, respectively.
Abbreviations: NE, nanoemulsion; NG, NE gel; TEM, transmission electron microscopy.
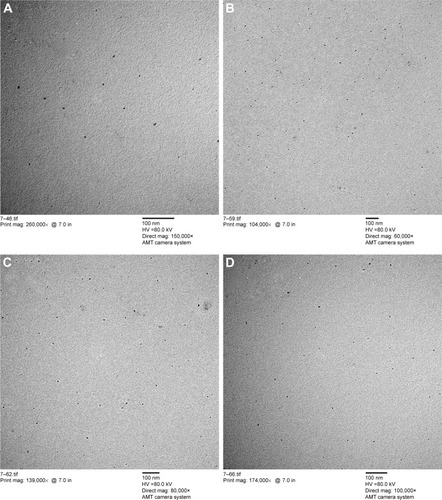
Table 1 Stability of the NE and NGs treated with either extreme gravity (ie, centrifugation) or high temperature
Figure 6 Influence of pH on the (A) DSD and (B) zeta potential of the NE and NGs.
Notes: NG1, NG2, NG3: NE gels containing 1%, 2%, and 3% (w/w) Carbopol® 934. Error bars represent mean ± SD.
Abbreviations: DSD, drop size distribution; NE, nanoemulsion; NG, NE gel.
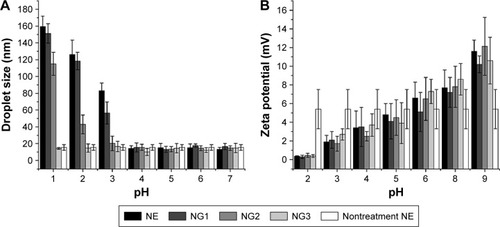
Table 2 Mean erythema/edema scores 24, 48, and 72 h after application
Figure 7 HPLC diagrams of different formulations.
Notes: (A) NE and NGs, the specific peaks of TER and CIT; (B) BNE; (C) standard TER; (D) standard CIT. NG1, NG2, NG3: NE gels containing 1%, 2%, and 3% (w/w) Carbopol® 934, respectively.
Abbreviations: BNE, blank NE; CIT, citral; HPLC, high-performance liquid chromatography; NE, nanoemulsion; NG, NE gel; TER, terbinafine.
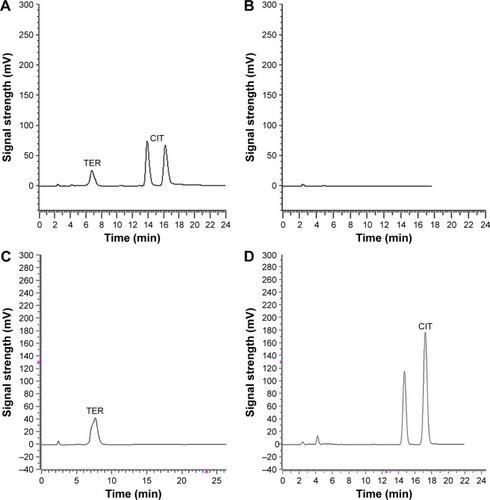
Table 3 Ex vivo skin permeation parameters over 24 h
Figure 8 Cumulative permeation of (A) TER and (B) CIT through guinea pig abdominal skin in vitro.
Note: NG1, NG2, NG3: NE gels containing 1%, 2%, and 3% (w/w) Carbopol® 934, respectively.
Abbreviations: CG, conventional gel; CIT, citral; NE, nanoemulsion; TER, terbinafine.
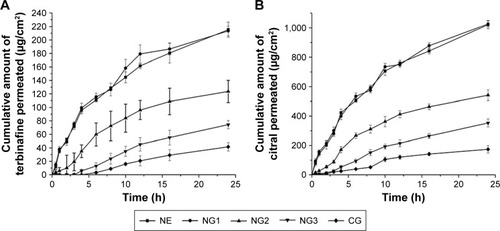
Table 4 Temporal changes in the deposition of TER and CIT3
Figure 9 Visualization of drug traces in the abdominal skin of guinea pigs 2, 6, and 12 h after application of NE, NGs, and CG.
Notes: NG1, NG2, NG3: NE gels containing 1%, 2%, and 3% (w/w) Carbopol® 934, respectively. (A–C) The trace of drugs in skin layers treated with NE, (D–F) NG1, (G–I) NG2, (J–L) NG3, and (M–O) CG at time intervals 2, 6 and 12 h, respectively.
Abbreviations: CG, conventional gel; NE, nanoemulsion; NG, NE gel.
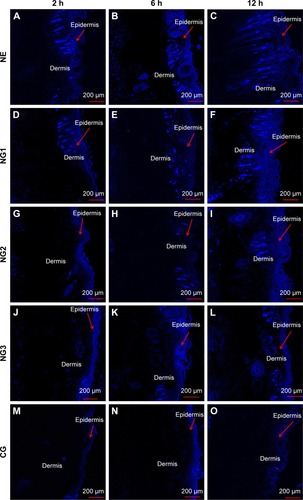
Figure 10 Skin histological cross sections 2, 6, and 12 h after application of the NE and NGs.
Notes: NG1, NG2, NG3: NE gels containing 1%, 2%, and 3% (w/w) Carbopol® 934, respectively. All figures were magnified 200 fold. (A) Normal structure of skin, (B–D) the structure of skin treated with NE, (E–G) NG1, (H–J) NG2, and (K–M) NG3 at time intervals 2, 6 and 12 h, respectively.
Abbreviations: NE, nanoemulsion; NG, NE gel.