
Figures & data
Figure 1 Chemical structure of oleanolic acid.
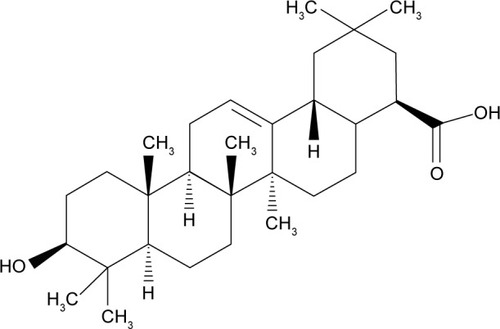
Figure 2 Preparation scheme of OA-micelles via the self-assembly method and different phenomena between OA-micelles and free OA in the cell.
Abbreviations: EtOh, ethyl alcohol; OA, oleanolic acid; P105, Pluronic P105; TPGS, d-α-tocopheryl polyethylene glycol succinate.
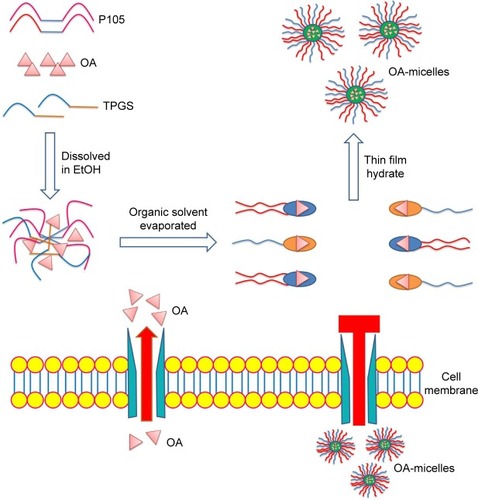
Figure 3 Characterization of OA-micelles.
Notes: (A) Size distribution spectrum of OA-micelles; (B) zeta potential spectrum of OA-micelles; and (C) transmission electron micrograph of OA-micelles (bar 100 nm).
Abbreviation: OA, oleanolic acid.
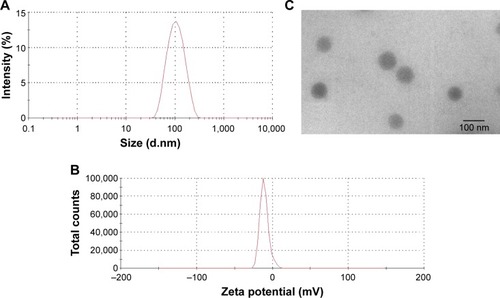
Figure 4 Cumulative release of OA from the OA-micelles and free OA in PBS (pH 7.4).
Abbreviations: OA, oleanolic acid; PBS, phosphate-buffered saline.
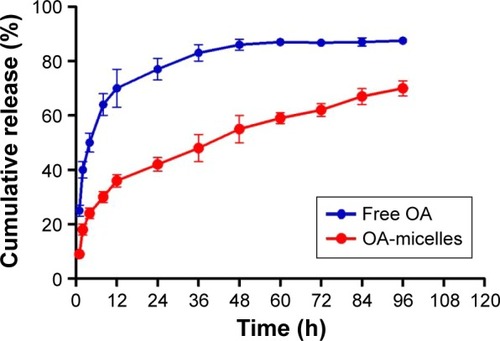
Figure 5 In vivo images of tumor-bearing mice after intravenous injection of DiR-micelles (n=3).
Abbreviation: DiR, 1,1′-dioctadecyl-3,3,3′,3′-tetramethyl indotricarbocyanine iodide.
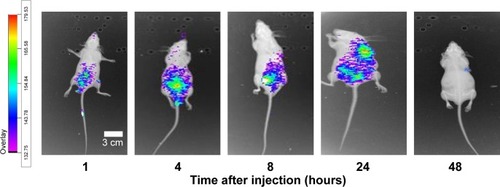
Figure 6 Cellular uptake of C6-micelles.
Notes: Images of A549 (A) and PC-9 (B) lung cancer cells treated with C6-micelles and free C6 (magnification 400×). (C) Mean values of integral optical density after treatment with C6-micelles and free C6. n=3, **P<0.01.
Abbreviations: C6, coumarin 6; DAPI, 4′,6-diamidino-2-phenylindole; IOD, integrated optical density.
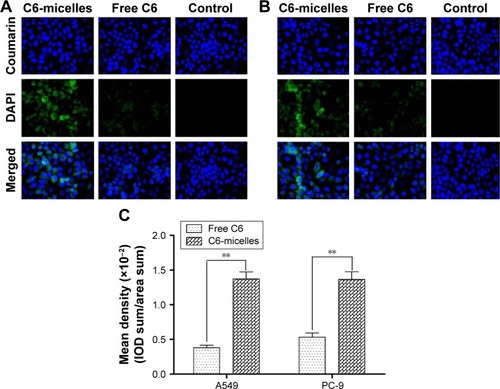
Figure 7 The antitumor effect of OA-micelles on mice bearing A549 cells.
Notes: (A) Xenograft tumors were excised on day 14 after initial treatment; (B) tumor volume changes as a function of time after intravenous injection of vehicle, free OA, OA-micelles, and cisplatin; (C) average tumor weight after last treatment; and (D) body weight changes of tumor-bearing mice after treatment. *P<0.05, **P<0.01.
Abbreviation: OA, oleanolic acid.
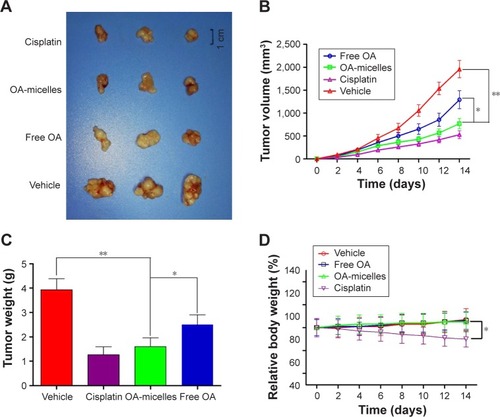
Figure 8 Immunohistochemistry for Bax, Bcl-2, and Caspase-3 from A549 xenografts.
Notes: Data expressed as mean ± SD. n=5 or more. *P<0.05, **P<0.01. Magnification 400×. (A) Immunohistochemistry for Bax, Bcl-2, Caspase-3 in each group. (B) Expression of Bax protein in each group. (C) Expression of Bcl-2 protein in each group. (D) Expression of Caspase-3 protein in each group.
Abbreviations: IOD, integrated optical density; SD, standard deviation; OA, oleanolic acid.
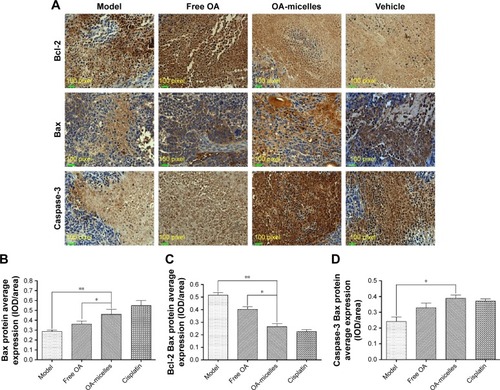
Figure 9 The in vitro antitumor activity of free OA and OA-micelles.
Notes: MTT assay of A549 (A) and PC-9 (B) cells; (C) flow cytometry of Annexin V and PI staining. The cells were incubated with free OA and OA-micelles for 24 h. Data are presented as mean ± standard deviation (n=3).
Abbreviations: OA, oleanolic acid; MTT, 3-(4,5-dimethylthiazol-2-yl)-2,5-diphenyltetrazolium bromide; PI, propidium iodide.
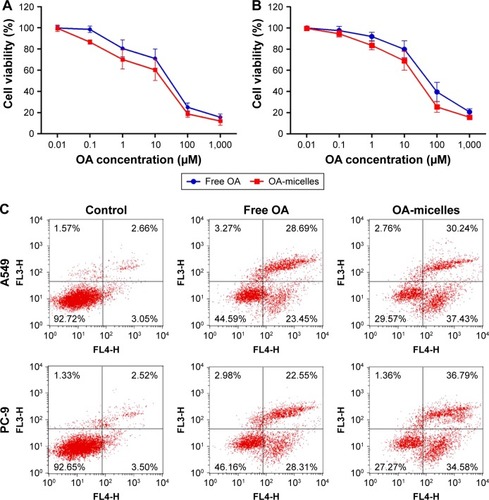
Figure 10 Wound healing assay detecting migration capacity and transwell assays detecting invasion capacity of NSCLC cells.
Notes: (A and B) Gaps of (A) A549 and (B) PC-9 cells after wound scratch at 0 and 24 h (magnification 100×); (C and D) gap length in each group after 24 h treatment: (C) A549 and (D) PC-9; (E and F) effect of OA-micelles and free OA on invasion of (E) A549 and (F) PC-9 cells (magnification 200×); (G and H) invasion rate of OA-micelles and free OA on (G) A549 and (H) PC-9 cells. *P<0.05, **P<0.01.
Abbreviations: NSCLC, non-small-cell lung cancer; OA, oleanolic acid.
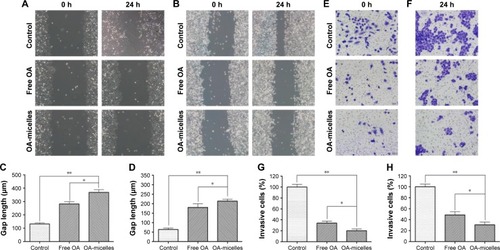
Figure 11 Immunofluorescence analysis of E-cadherin expression in A549 (A) and PC-9 cells (B); N-cadherin expression in A549 (C) and PC-9 cells (D); (magnification 400×); (E [A549] and F [PC-9]) quantified expression of N-cadherin and E-cadherin in A549 and PC-9 cells.
Notes: The data are presented as mean ± standard deviation. **P<0.01.
Abbreviations: DAPI, 4′,6-diamidino-2-phenylindole; IOD, integrated optical density; OA, oleanolic acid.
![Figure 11 Immunofluorescence analysis of E-cadherin expression in A549 (A) and PC-9 cells (B); N-cadherin expression in A549 (C) and PC-9 cells (D); (magnification 400×); (E [A549] and F [PC-9]) quantified expression of N-cadherin and E-cadherin in A549 and PC-9 cells.Notes: The data are presented as mean ± standard deviation. **P<0.01.Abbreviations: DAPI, 4′,6-diamidino-2-phenylindole; IOD, integrated optical density; OA, oleanolic acid.](/cms/asset/c1d728ff-6ce9-4894-8005-b7930505e945/dijn_a_12193428_f0011_b.jpg)
Figure 12 Western blot analysis of NSCLC cells treated with control media, free OA, and OA-micelles.
Notes: (A and B) Western blot analysis of the EMT-related proteins, Caspase-3 and p-ERK, in A549 and PC-9 cells. β-actin expression is shown as a loading control. (C [A549] and D [PC-9]) The figures are representative of three independent experiments. The data are presented as mean ± standard deviation. *P<0.05, **P<0.01.
Abbreviations: NSCLC, non-small-cell lung cancer; OA, oleanolic acid; EMT, epithelial–mesenchymal transition.
![Figure 12 Western blot analysis of NSCLC cells treated with control media, free OA, and OA-micelles.Notes: (A and B) Western blot analysis of the EMT-related proteins, Caspase-3 and p-ERK, in A549 and PC-9 cells. β-actin expression is shown as a loading control. (C [A549] and D [PC-9]) The figures are representative of three independent experiments. The data are presented as mean ± standard deviation. *P<0.05, **P<0.01.Abbreviations: NSCLC, non-small-cell lung cancer; OA, oleanolic acid; EMT, epithelial–mesenchymal transition.](/cms/asset/6657b59c-d04e-45be-a385-82880481de8d/dijn_a_12193428_f0012_b.jpg)