Figures & data
Figure 1 X-ray diffraction patterns of PLA (A), 8 (B), 16 (C), 32 (D) wt% of Ag/PLA-NCs.
Abbreviations: PLA, poly (lactic acid); NC, nanocomposite.
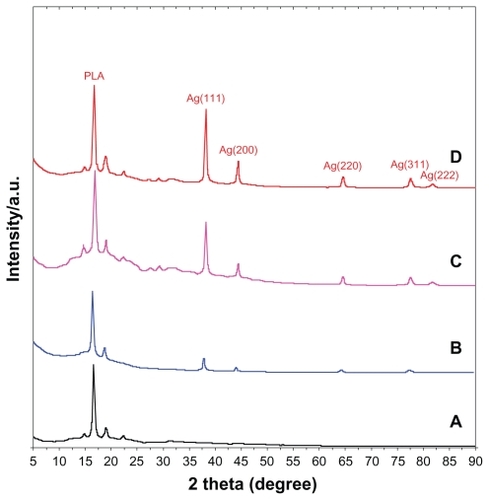
Figure 2 UV-visible spectra of PLA (A), 8 (B), 16 (C), 32 (D) wt% of Ag/PLA-NCs.
Abbreviations: PLA, poly (lactic acid); NC, nanocomposite.
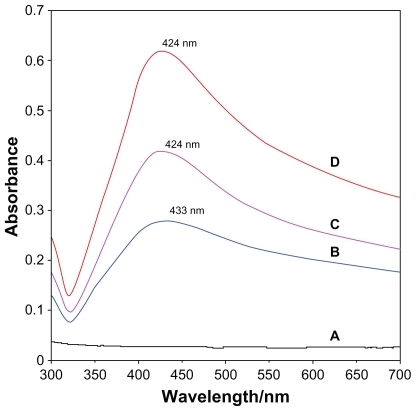
Figure 3 Transmission electron microscopy images and their corresponding size distributions of Ag/PLA-NCs at different Ag-NP percentages: 8 (A, B), 16 (C, D), and 32 wt% (E, F).
Abbreviations: PLA-NC, poly (lactic acid) nanocomposite; Ag-NP, silver nanoparticle.
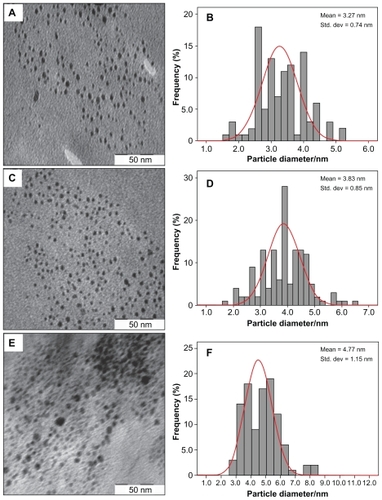
Figure 4 Fourier transform infrared spectra of PLA (A), Ag/PLA-NCs at 8 (B), 16 (C), 32 (D) wt% Ag-NPs.
Abbreviations: PLA, poly (lactic acid); NC, nanocomposite; Ag-NP, silver nanoparticle.
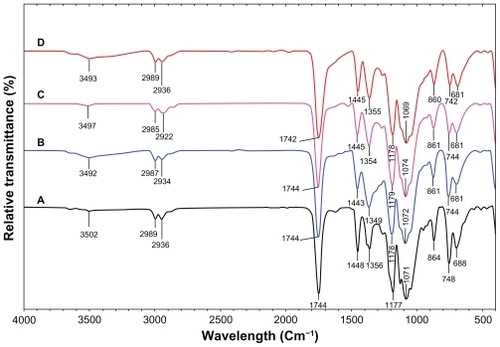
Figure 5 Ag+ release curves of Ag/PLA-NCs in PBS (pH = 7.00) with 8, 16, and 32 wt% respectively.
Abbreviations: PLA, poly (lactic acid); NC, nanocomposite; PBS, phosphate buffer
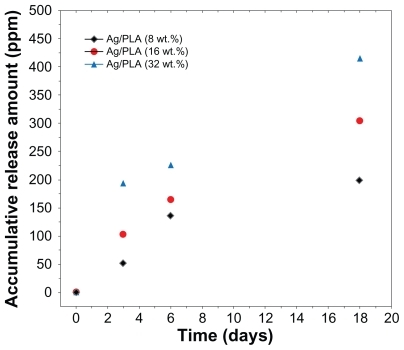
Figure 6 Comparison of inhibition zone test for Vibrio parahaemolyticus between PLA (A), Ag/PLA-NC content 8 (B), 16 (C), and 32 (D) wt% respectively.
Abbreviations: PLA, poly (lactic acid); NC, nanocomposite.
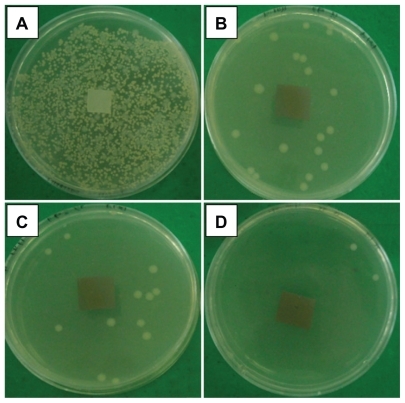
Table 1 Average of inhibition zones for PLA and Ag/PLA-NCs content 8, 16, and 32 wt%