Figures & data
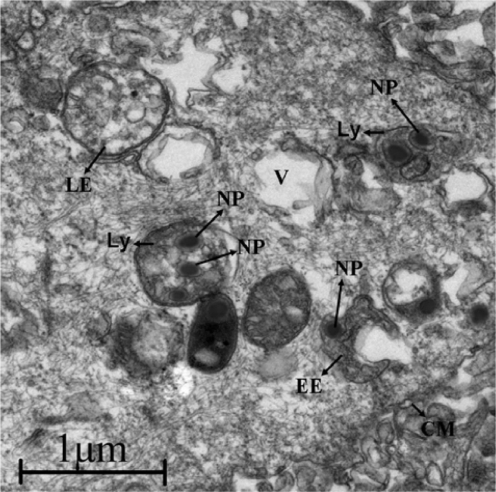
Figure 1 A) Summary of characterization of particles. B) Size distribution detected by laser diffraction particle size analyzer.
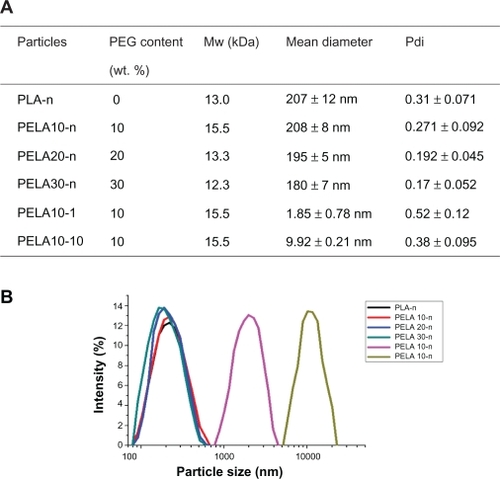
Figure 2 Morphology of particles detected by SEM. A, B, C, D, E, and F denote PLA-n, PELA10-n, PELA20-n, PELA30-n, PELA10-1, and PELA10-10, respectively.
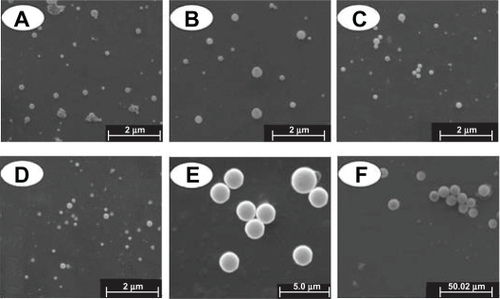
Figure 3 Morphology of nanospheres detected by AFM. A, B, C, and D denote PLA-n, PELA10-n, PELA20-n, PELA30-n, respectively. Samples were prepared for AFM investigation.
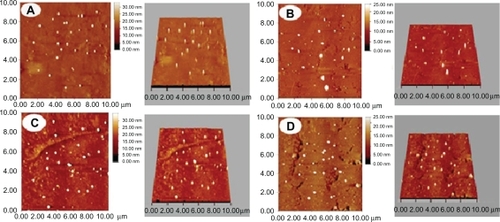
Figure 4 A) Optical microscopic observation (×200) of osteoblasts incubated with PLA-n (A), PELA10-n (B), PELA20-n (C), PELA30-n (D), PELA10-1 (E), and PELA10-10 (F) particles from 1 to 3 days. B) Viability of osteoblasts from 1 to 3 days by MTT assay, P < 0.05.
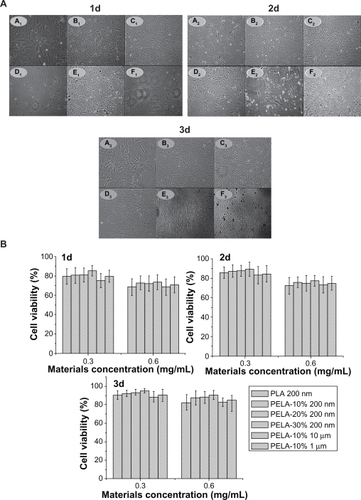
Figure 5 Cell apoptosis profiles of osteoblasts as a function of incubation time (0.3 mg/mL, 37 °C) detected by flow cytometer A) and cell apoptosis rate of osteoblasts by flow cytometer B).
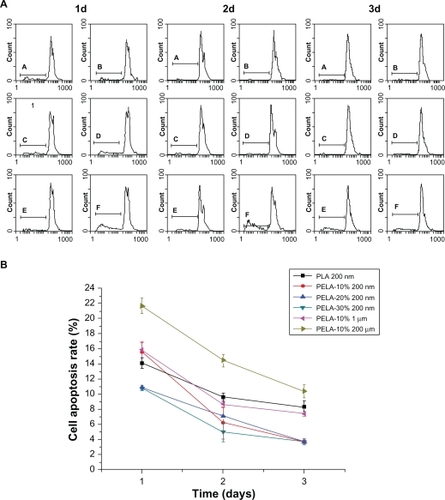
Figure 6 A) Fluorescence intensity of nanospheres in osteoblasts detected by fluorescence spectrophotometer. B) Fluorescent microscopy utilized to assess cellular uptake of nanospheres as a function of incubation time (0.3 mg/mL, 37 °C). Osteoblasts were incubated with the nanospheres under the condition as indicated above each image, and samples were prepared for fluorescence microscope (×200) investigation. Bars = 20 μm.
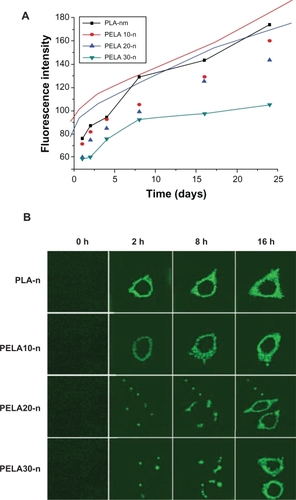
Figure 7 TEM photo showing intracellular fate of nanospheres. Some nanospheres were localized in endosomes and lysosomes.
Abbreviations: Ly, lysosome; LE, late endosomes; EE, early endosomes; V, vacuole; CM, cell membrane; NP, nanoparticles.