Figures & data
Figure 1 Treatment scheme (A) and experimental setup (B) for in vivo experiments.
Notes: (A) Applied treatment scheme for the performed in vivo experiments. (B) Magnetic heating was induced by exposing the intratumorally applied nanoparticles (orange spots) to an AMF (H =23.9 kA/m, f =410 kHz). An IR was placed vertically above the tumor/coil for acquiring tumor surface temperatures (heat maps). Body temperature was controlled rectally via fiber optic temperature sensors. Anesthetized mice were placed in a water-perfused heat shell to prevent hypothermia during treatment. Copyright ©2017. Dove Medical Press. Adapted from Stapf M, Pömpner N, Kettering M, Hilger I. Magnetic thermoablation stimuli alter BCL2 and FGF-R1 but not HSP70 expression profiles in BT474 breast tumors. Int J Nanomedicine. 2015;10(10):1931–1939.Citation17
Abbreviations: AMF, alternating magnetic field; CT, computerized tomography; IR, infrared thermography camera.
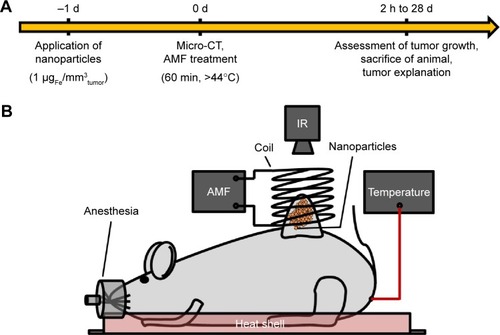
Figure 2 Characterization of the used nanoparticles.
Notes: (A) Core sizes were stated as given in the datasheet of the supplier. The hydrodynamic diameter (n=5) and the ζ-potential (n=3) were analyzed in double distilled water. Standard deviations are given in brackets. (B) Depiction of the clustered particle cores as observed by high resolution transmission electron microscopy. (C) SAR of the used MNPs (n=3) measured as water suspension (ferrofluid) or after immobilization in 10% PVA.
Abbreviations: MNPs, magnetic nanoparticles; MTX, methotrexate; PDI, polydispersity index; PVA, polyvinyl alcohol; SAR, specific absorption rate.
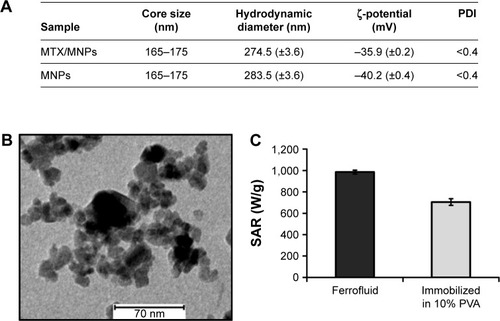
Figure 3 Preferential and time-dependent uptake of MTX/MNPs.
Notes: Cells were incubated with 100 µg/mL of either MTX/MNPs or MNPs (both n=3) for the stated period of time, and intracellular iron was quantified by AAS measurements. Results were generated from triplets of two independent experiments. Student’s t-test (two-sided, paired) showed significant differences between the groups with *P<0.05, **P<0.01, and ***P<0.001.
Abbreviations: AAS, atomic absorption spectroscopy; MNPs, magnetic nanoparticles; MTX, methotrexate.
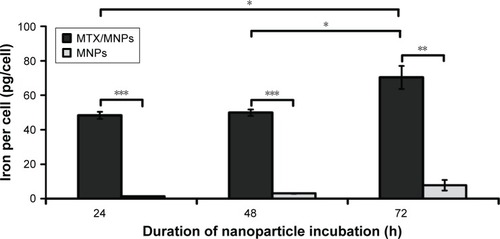
Figure 4 Increased uptake of MTX/MNPs correlated with higher temperatures and a reduced viability after in vitro hyperthermia.
Notes: (A) Representative microscopic images of the different treatment groups prior to cell harvest. (B) Representative temperature curve after magnetic heating to a target temperature of 44°C for 60 min in an AMF (H =23.9 kA/m, f =410 kHz). (a) MTX/MNPs; (b) MNPs; (c) MTX; (d) control. (C) Cellular viability as assessed by AlamarBlue® assay (n=6). Throughout in vitro experiments, the following concentrations were used: MTX/MNPs, 100 µg/mL; MNPs, 100 µg/mL; MTX, 25 µg/mL. Scale bar: 100 µm. Student’s t-test showed significant differences between the groups with *P≤0.05, **P≤0.01, and ***P≤0.001.
Abbreviations: AMF, alternating magnetic field; MNPs, magnetic nanoparticles; MTX, methotrexate.
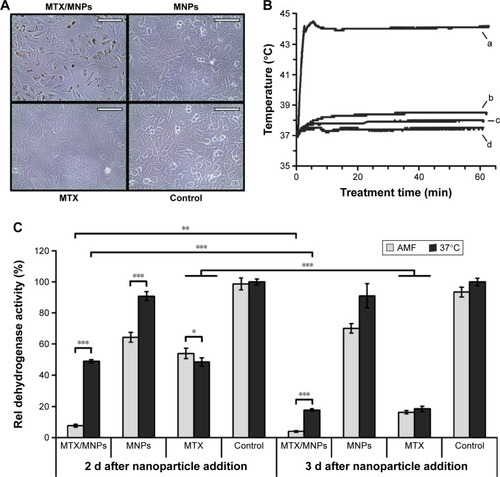
Figure 5 Micro-CT images revealed inhomogeneous intratumoral distribution of nanoparticles.
Notes: Representative micro-CT image at 24 h after intratumoral nanoparticle application. After reconstruction, different body parts were colored based on their HU-values (via Imalytics software) for better visualization. The tumor area is highlighted with a dashed line.
Abbreviation: CT, computed tomography.
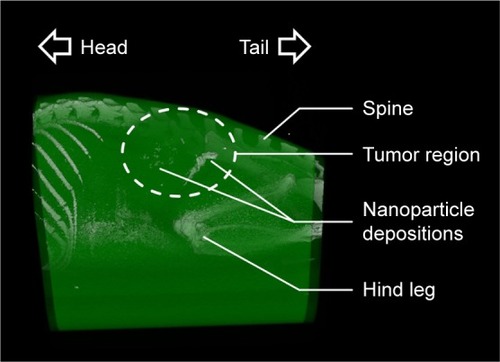
Figure 6 Fastest reduction of tumor growth after nanochemothermal treatment.
Notes: Tumor volumes (n≥2) of each animal were normalized to the tumor volume at the day of nanoparticle injection (−1 d; 1 µgFe/mm³Tumor) and depicted as the median of relative tumor volumes. The median CEM43T90 was slightly lower for the nanochemothermal group (122 min) than for the thermal group (155 min). AMF: H =23.9 kA/m, f =410 kHz.
Abbreviations: AMF, alternating magnetic field; MNPs, magnetic nanoparticles; MTX, methotrexate.
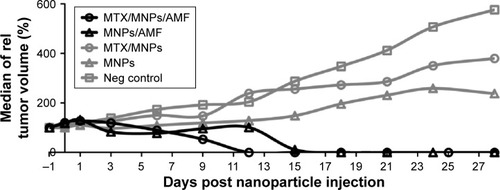
Figure 7 Enhanced induction of apoptosis by nanochemothermia.
Notes: Representative images of tumor sections stained by TUNEL assay at 48 h after AMF exposure (n=3). Apoptotic areas are indicated by brown staining of the nuclei and cytoplasm. Representative apoptotic nuclei were marked by arrows. Throughout all in vivo experiments, nanoparticle concentrations of 1 µgFe/mm³Tumor were used. AMF: H =15.4 kA/m, f =435 kHz; positive control: DNAse I treated sections; scale bar: 50 µm.
Abbreviations: AMF, alternating magnetic field; MNPs, magnetic nanoparticles; MTX, methotrexate; TUNEL, transferase dUTP nick end labeling.
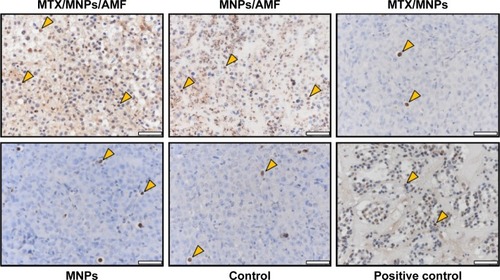
Figure 8 Treatment-dependent expression of proteins associated with cellular apoptosis and survival, angiogenesis, and cell cycle.
Notes: Representative images of at least two independent experiments. Numbers above the blot indicate the time after (theoretical) AMF exposure. Representative images for GAPDH were chosen as loading control. Throughout all in vivo experiments, nanoparticle concentrations of 1 µgFe/mm³Tumor were used. AMF: H =15.4 kA/m, f =435 kHz.
Abbreviations: AMF, alternating magnetic field; C, negative control; GAPDH, glyceraldehyde 3-phosphate dehydrogenase; MNPs, magnetic nanoparticles; MTX, methotrexate; PARP, poly(ADP-ribose) polymerase; VEGF, vascular endothelial growth factor.
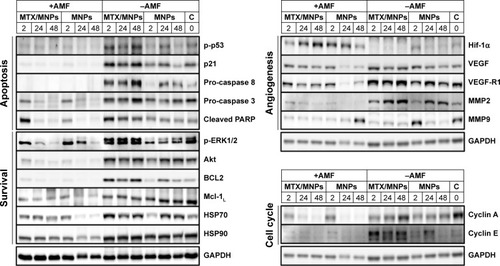
Figure S1 The influence of pH and time (A) and the pH and temperature (B) onto the stability of MTX/MNPs.
Notes: MTX/MNPs were incubated for the stated time under the corresponding conditions. 0 h: amount of MTX/MNP-bound MTX directly after coupling process (n≥3).
Abbreviations: MNPs, magnetic nanoparticles; MTX, methotrexate.
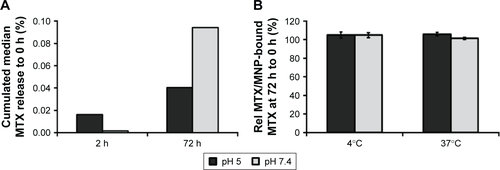
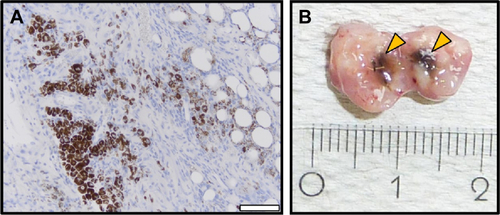
Figure S2 Microscopic (A) and macroscopic (B) MTX/MNP depositions in the tumor at 28 d after MTX/MNP application.
Notes: (A) Hematoxylin and eosin staining of 3 µm tumor sections (FFPE) indicated diffuse and cytoplasmatic localization of intratumorally applied MTX/MNPs, allowing a repetition of AMF treatment. (B) Macroscopic depictions of the dissected tumor reveled regions with high MTX/MNP depositions (arrow). Blue, nuclei; brown, MTX/MNPs. Scale bar: 50 µm.
Abbreviations: AMF, alternating magnetic field; FFPE, formalin-fixed and paraffin embedded; MNPs, magnetic nanoparticles; MTX, methotrexate.