Figures & data
Table 1 Mean particle size of empty SLNs prepared at RT (Gelucire® = 400 mg) and at CT (Compritol® = 200 mg), with 5% w/v PVAL; n = 3
Table 2 Composition of the formulations, percentage (w/w) of CyA with respect to the weight of lipid, mean particle size, Z-potential and probable day of aggregation of SLNs prepared at RT (Gelucire®) with 5% w/v PVAL
Figure 1 Scanning electron micrographs of loaded Gelucire® 44/14 SLNs with different theoretical loadings (bar = 1 μm). A) CyA-Gelucire® (20:400 mg; 5% CyA) t = 0; B) CyA-Gelucire® (40:400 mg; 10% CyA) t = 0; C) CyA-Gelucire® (30:400 mg; 7.5% CyA) t = 0; D) CyA-Gelucire® (30:400 mg; 7.5% CyA) t = 4 months.
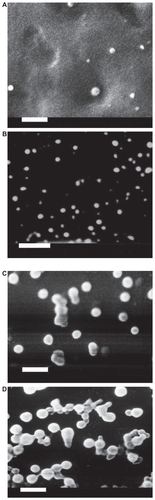
Figure 2 DSC thermograms of A) CyA; B) Gelucire® 44/14; C) PVAL.
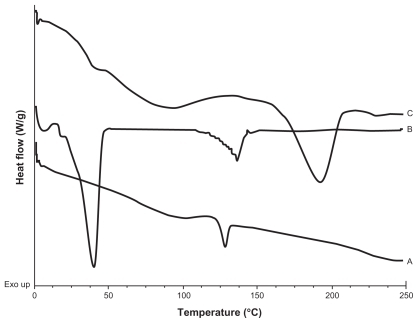
Figure 3 DSC thermograms of A) Physical mixture of CyA-Gelucire® (40:400 mg w/w); B) Physical mixture of CyA-Gelucire® (80:400 mg w/w); C) Physical mixture of CyA-Gelucire® (200:400 mg w/w); D) Physical mixture of CyA-PVAL (20:100 mg w/w); E) Physical mixture of CyA-PVAL (80:100 mg w/w); and F) Physical mixture of CyA-PVAL (200:100 mg w/w).
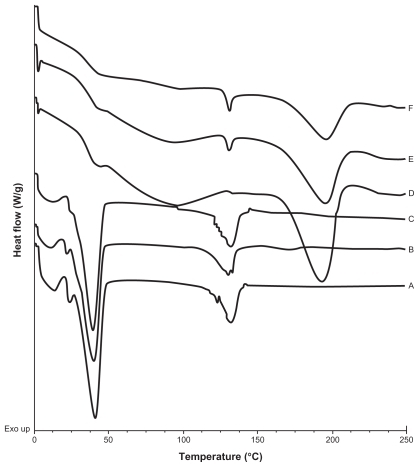
Figure 4 DSC thermograms of A) and B) batches prepared with CyA only, t = 0 and t = 5 months respectively; C) and D) empty SLNs; t = 0 and t = 5 months respectively; E) and F) SLNs with 5% CyA (drug-lipid ratio 20:400 (w/w)), t = 0 and t = 5.5 months, respectively; G) and H) SLNs with 15% CyA (drug-lipid ratio 60:400 (w/w)), t = 0 and t = 5.5 months, respectively; I) and J) SLNs with 50% CyA (drug-lipid ratio 200:400 (w/w)), t = 0 and t = 5.5 months, respectively.
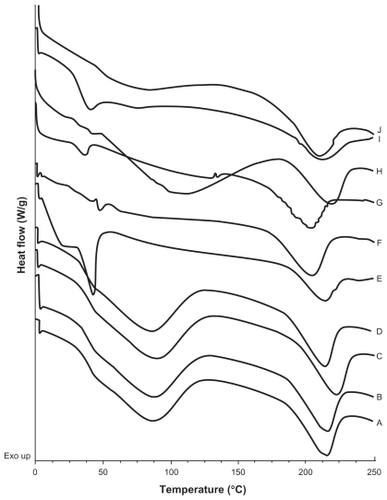
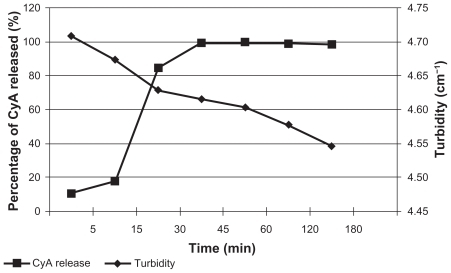
Figure 5 In vitro release of CyA and turbidity changes during this experiment.