Figures & data
Table 1 The sequences of the inserted DNA fragments
Figure 1 Optical property analysis and dynamic light scattering (DLS) of the CdTe/ZnSe QDs conjugated with nucleobases.
Notes: (A) and (C) are showing the absorbance and fluorescence spectra of the QDs with or without nucleobases, respectively. (B) The photographs of the samples under visible light (upper panel) and UV light (lower panel). (D) The fluorescence intensities of the QDs after the interaction with the nucleobases of different concentrations. X-axis is showing the final concentration of the nucleobases in the prepared samples. Y-axis is showing the fluorescence intensities of the samples. Data represent the mean ± SD, n=5. P<0.05 (empty triangle), P<0.01 (empty square). (E) and (F) are showing the fluorescence microscopic and SEM images of the QDs with or without the nucleobases, respectively. (G) The DLS measurements of the QDs. Column charts are indicating the size of the QDs with or without the nucleobases.
Abbreviations: QD, quantum dot; QD+A, quantum dot + adenine; QD+C, quantum dot + cytosine; QD+G, quantum dot + guanine; QD+T, quantum dot + thymine; SD, standard deviation; SEM, scanning electron microscopy; UV, ultraviolet.
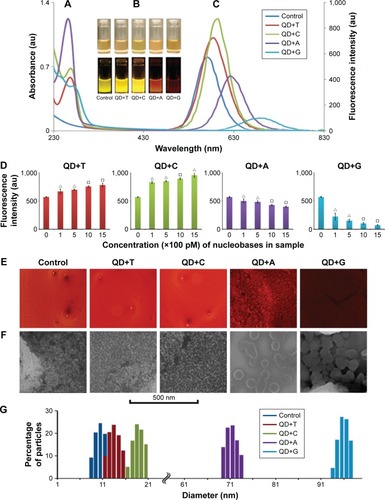
Table 2 The results of zeta potential of the QDs before and after the interaction with the nucleobases
Figure 2 The Fourier transform infrared spectroscopy spectra of CdTe/ZnSe quantum dots (QDs) conjugated with adenine, guanine, cytosine, and thymine are shown in (A–D), respectively.
Note: The presence of the bases was proved by the presence of the characteristic peaks in the spectra.
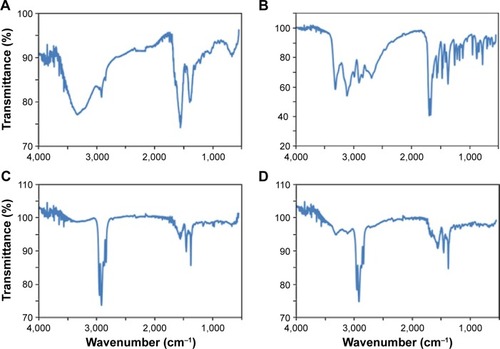
Figure 3 Electrochemical analysis and scanning electrochemical microscopy.
Notes: (A) The electrochemical study of CdTe/ZnSe QDs with or without different nucleobases (adenine, cytosine, thymine, and guanine). (a1) The voltammograms of the QDs modified with various nucleobases were obtained by different pulse voltammetry on mercury electrode (HMDE) coupled with adsorptive technique. (a2) The dependence of the peak heights (c1–c4) on the samples and control is presented here. (B) The electrochemical study of the individual parts of the QDs. (b1) The voltammograms of the QDs and their individual parts were obtained using the same technique described as before. (b2) The dependence of the peak heights on the individual parts of the core-shell structures is presented here. The dependences are presented for the detected peaks c1–c4. The data are expressed as mean ± SD, n=5. (C) The SECM data of the QDs conjugated with thymine, cytosine, adenine, and guanine (c2–c5, respectively) and control (c1, QDs without bases) are shown in terms of the changes of average current intensities.
Abbreviations: QD, quantum dot; QD+A, quantum dot + adenine; QD+C, quantum dot + cytosine; QD+G, quantum dot + guanine; QD+T, quantum dot + thymine; SD, standard deviation.
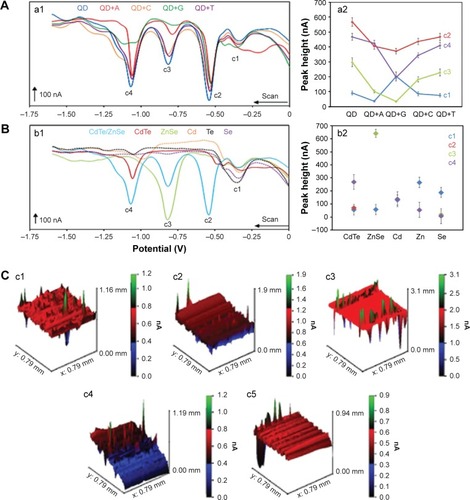
Figure 4 The detection of DNAs from different sources, DNA damage, and mutation using CdTe/ZnSe QDs.
Notes: The fluorescence spectra of the QDs after the interaction with the damaged and undamaged DNAs of PC3 and PNT1A cells are represented in (A) and (B), respectively. The microscopic photos of the used PC3 and PNT1A cells are shown in the left panel of (A) and (B), respectively. (C) The fluorescence spectra of the QDs after the interaction with the DNAs from different sources and the mixture of A, T, G, and C (equimolar mixture, 1 nM). (D) The interaction of the QDs with the plasmid (pGEM-T) with or without insert DNAs. The vertical axis represents the wavelength (nm) of the fluorescence emission maxima of the samples. Data represent the mean ± SD, n=5. P<0.01 (empty square), or P<0.001 (full square).
Abbreviation: QD, quantum dot.
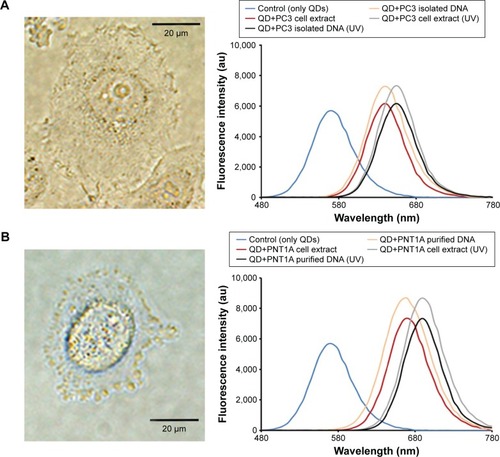
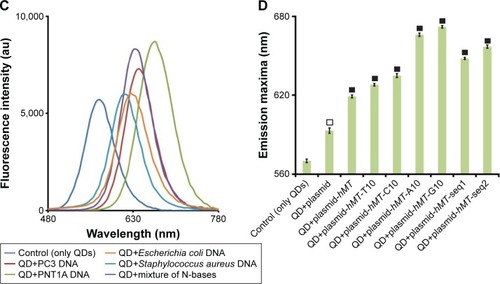
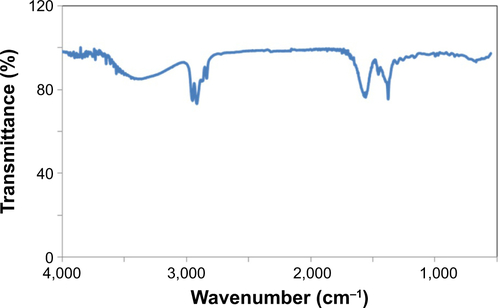
Figure S1 FTIR spectrum of CdTe/ZnSe QDs.
Abbreviations: FTIR, fourier transform infrared spectroscopy; QD, quantum dot.