Figures & data
Figure 1 Schematic representation of a quartz functionalized with an anti-fouling PEG-silane coating.
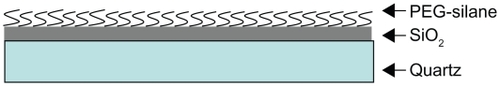
Figure 2 High-resolution SEM image of a granular Ni film (1 nm nominal thickness) deposited by thermal evaporation onto a SiO2 surface.
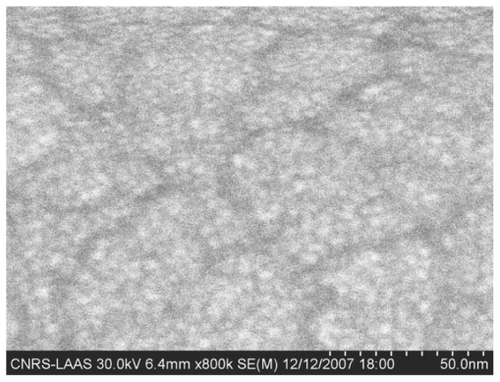
Figure 3 AFM image of a granular Ni film (1 nm nominal thickness) deposited by thermal evaporation onto a SiO2 surface.
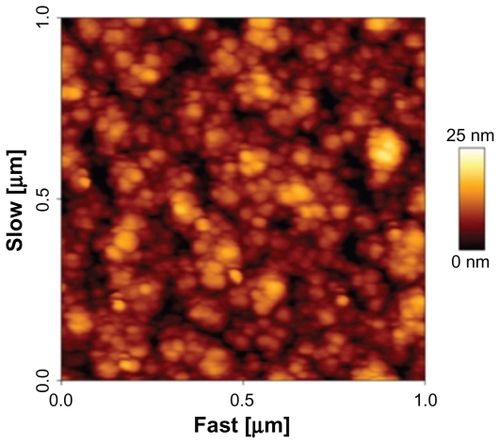
Figure 4 Schematic representation of a quartz functionalized with an antibiofouling PEG-silane coating plus 5 nm size Ni nanoislands.
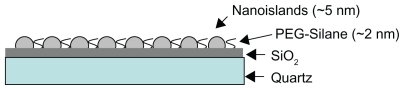
Figure 5 Fluorescence microscopy characterizations of the 6His-tagged green fluorescent proteins (GFP) adsorption, onto the different quartz surfaces. A) PEG-silane onto SiO2 B) SiO2 C) PEG-silane plus Ni nanoislands.
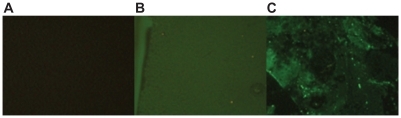
Figure 6 QCM signals obtained after the incubation of a solution of glycerin diluted in HEPES buffer at various concentrations (percentage in volume). A) quartz-SiO2 coated with PEG B) virgin quartz-SiO2.
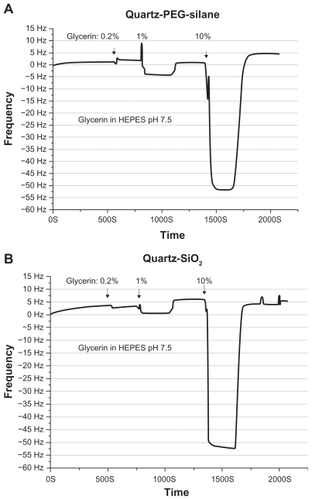
Figure 7 ELISA tests showing the selectivity of the selected probe molecule (His tagged scFv-F7N1N2) to the active conformation of RhoA proteins (RhoA GTPgS) compared to the inactive conformation (RhoA GDP) of the same protein.
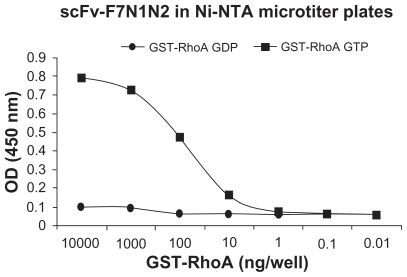
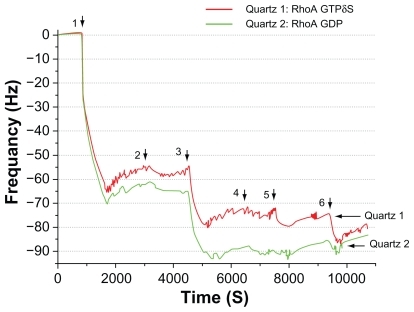
Figure 8 QCM Frequency variations of two identical quartz (SiO2/PEG/Ni nanoislands) subjected to different incubation steps.