Figures & data
Figure 1 Schematic depiction of IONP synthesis.
Notes: (A) Uncoated IONPs; (B) FemOn-SiO2 composite IONPs; (C) Silica-iron oxide core-shell structured IONPs.
Abbreviations: IONPs, magnetic iron oxide nanoparticles; RT, room temperature; TEOS, tetraethyl orthosilicate.
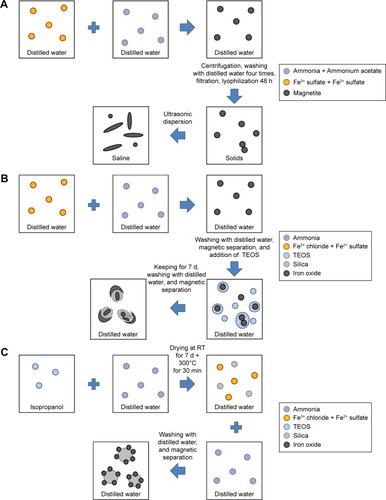
Figure 2 Characteristics of IONPs.
Notes: (A) TEM image of bare IONPs. (B) TEM image of FemOn-SiO2 composite IONPs. (C) TEM image of SiO2-FemOn core-shell IONPs. (D) and (E) Atomic force microscopy image of FemOn-SiO2 composite and SiO2-FemOn core-shell IONPs, respectively. (F) Hydrodynamic diameters of IONPs as measured by dynamic light scattering. (G) Room temperature mass magnetization curves for IONPs. (H) Fourier transform infrared spectra of IONPs.
Abbreviations: IONPs, magnetic iron oxide nanoparticles; TEM, transmission electron microscopy.
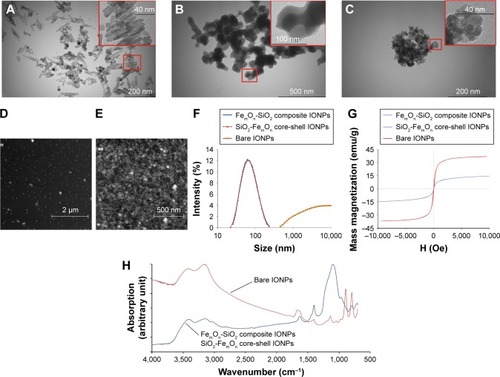
Table 1 The number of binucleated cells per field of view 48 h after incubation of HUVECs with 0.7 and 7.0 μg of uncoated IONPs, FemOn-SiO2 composite, and SiO2-FemOn core-shell IONPs
Figure 3 Bright-field microscopy of human umbilical vein endothelial cells with 50× magnification 48 h after incubating with IONPs at three different doses; 0.7, 7.0, and 70.0 μg.
Notes: The images are representative of at least three independent experiments. (A–C) controls; (D–F) bare IONPs; (G–I) FemOn-SiO2 composite IONPs; and (J–L) SiO2-FemOn core-shell IONPs.
Abbreviation: IONPs, magnetic iron oxide nanoparticles.
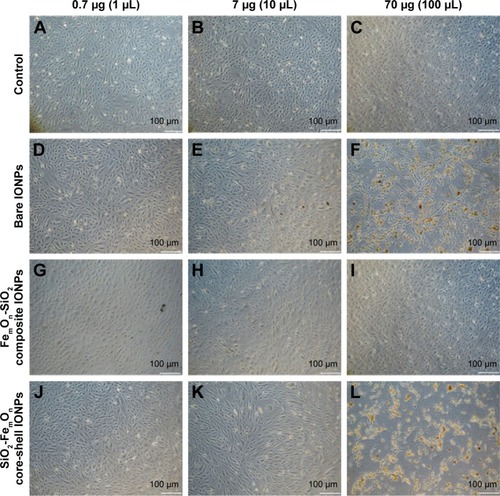
Figure 4 Morphology of human umbilical vein endothelial cells 48 h after incubation with different doses of IONPs according to forward and side scattering profiles obtained with flow cytometry analysis.
Notes: (A–C) Controls; (D–F) Bare IONPs; (G–I) FemOn-SiO2 composite IONPs; and (J–L) SiO2-FemOn core-shell IONPs.
Abbreviation: IONPs, magnetic iron oxide nanoparticles.
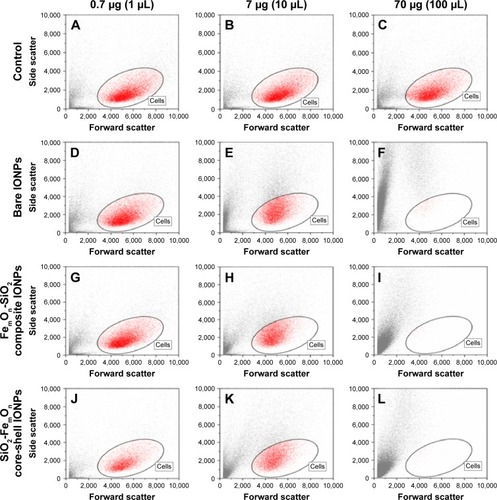
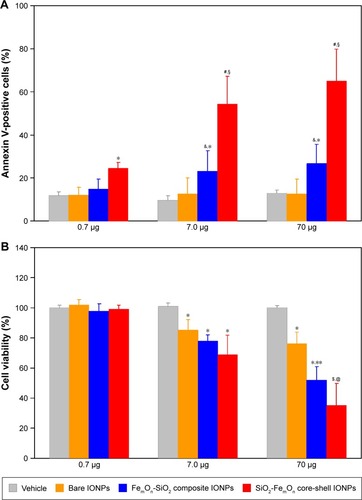
Figure 5 In vitro cytotoxicity of IONPs.
Notes: (A) Percentage of annexin V-positive HUVECs as determined with annexin V-phycoerythrin apoptosis detection kit 48 h after incubation with three different doses of IONPs. *P<0.05 vs vehicle, &P<0.05 vs respective value at a dose of 0.7 μg; #P<0.01 vs vehicle; §P<0.05 vs respective value at a dose of 0.7 μg; (B) 3-(4,5-dimethylthiazol-2-yl)-2,5-diphenyltetrazolium bromide cell viability assay after 48 h of treatment with three different doses of IONPs. *P<0.05 vs vehicle; **P<0.05 vs respective value at a dose of 7.0 μg; $P<0.01 vs vehicle; @P<0.05 vs respective value at a dose of 7.0 μg. Data are expressed as means ± standard deviation.
Abbreviation: IONPs, magnetic iron oxide nanoparticles.