Figures & data
Figure 1 Release curve of vancomycin in vitro.
Abbreviations: VC, vancomycin-loaded bone-like hydroxyapatite/poly amino acid group; PC, vancomycin-loaded polymethyl methacrylate group.
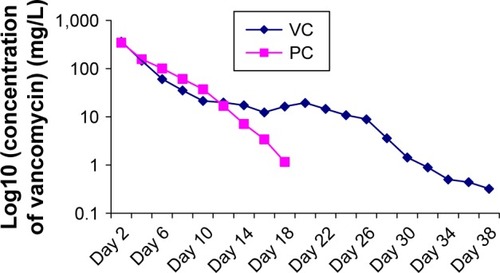
Figure 2 Cumulative release percentage of vancomycin.
Abbreviations: VC, vancomycin-loaded bone-like hydroxyapatite/poly amino acid group; PC, vancomycin-loaded polymethyl methacrylate group.
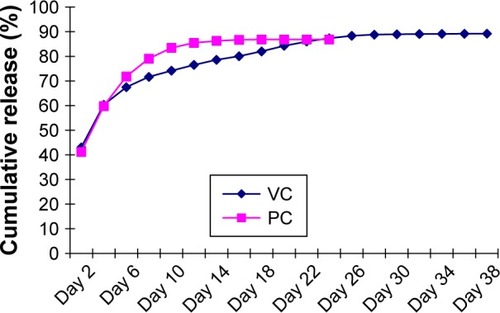
Table 1 Diameter of bacterial inhibition zone (, unit: mm)
Figure 3 Whether on regular S. aureus or MRSA, VC subgroup both showed strongest antibacterial activity.
Abbreviations: MRSA, methicillin-resistant Staphylococcus aureus; VUC, bone-like hydroxyapatite/poly amino acid group; PC, vancomycin-loaded polymethyl meth acrylate group; SV, standard vancomycin; VC, vancomycin-loaded bone-like hydroxyapatite/poly amino acid group.
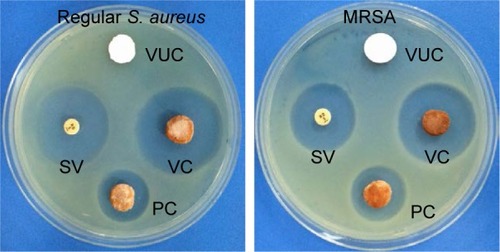
Figure 4 Antibacterial rate curve on regular S. aureus.
Note: Each data point represents a mean ± standard deviation (n=5).
Abbreviations: S. aureus, Staphylococcus aureus; VUC, bone-like hydroxyapatite/poly amino acid group; PC, vancomycin-loaded polymethyl meth acrylate group; VC, vancomycin-loaded bone-like hydroxyapatite/poly amino acid group.
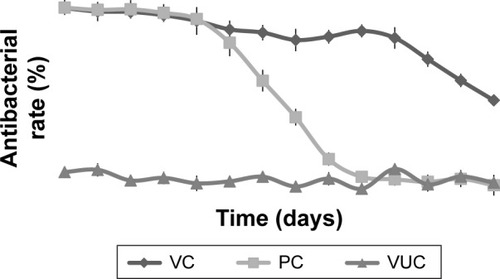
Figure 5 Antibacterial rate curve on MRSA.
Note: Each data point represents a mean ± standard deviation (n=5).
Abbreviations: MRSA, methicillin-resistant Staphylococcus aureus; VUC, bone-like hydroxyapatite/poly amino acid group; PC, vancomycin-loaded polymethyl methacrylate group; VC, vancomycin-loaded bone-like hydroxyapatite/poly amino acid group.
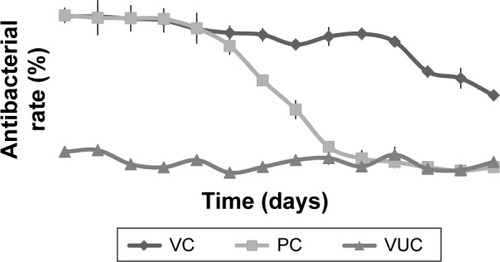
Figure 6 Adhesion of regular S. aureus on the surface of scaffolds under SEM ×1 k.
Abbreviations: SEM, scanning electron microscopy; S. aureus, Staphylococcus aureus; VUC, bone-like hydroxyapatite/poly amino acid group; PC, vancomycin-loaded polymethyl meth acrylate group; VC, vancomycin-loaded bone-like hydroxyapatite/poly amino acid group.
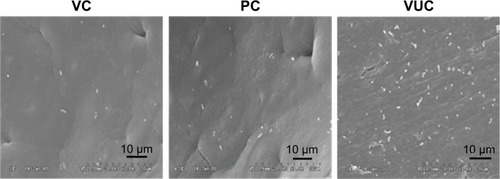
Figure 7 Adhesion of MRSA on the surface of scaffolds under SEM ×2 k.
Abbreviations: MRSA, methicillin-resistant Staphylococcus aureus; SEM, scanning electron microscopy; VUC, bone-like hydroxyapatite/poly amino acid group; PC, vancomycin-loaded polymethyl methacrylate group; VC, vancomycin-loaded bone-like hydroxyapatite/poly amino acid group.
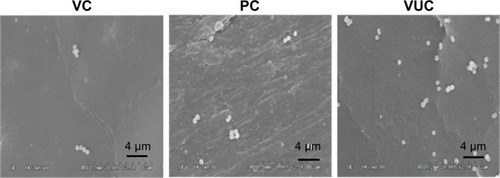
Figure 8 The change of body weight.
Notes: Regular-VC referred to subgroup VC of regular S. aureus group, and so on. Comparison of weight between pretreatment and the end time: regular-VC: P=0.007; regular-PC: P=0.09; regular-VUC: P=0.02; regular-NC: P=0.04; MRSA-VC: P=0.01; MRSA-PC: P=0.08; MRSA-VUC: P=0.04; MRSA-NC: P=0.02.
Abbreviations: MRSA, methicillin-resistant Staphylococcus aureus; VC, vancomycin-loaded bone-like hydroxyapatite/poly amino acid group; VUC, bone-like hydroxyapatite/poly amino acid group; PC, vancomycin-loaded polymethyl meth-acrylate group; NC, simulated body fluid group.
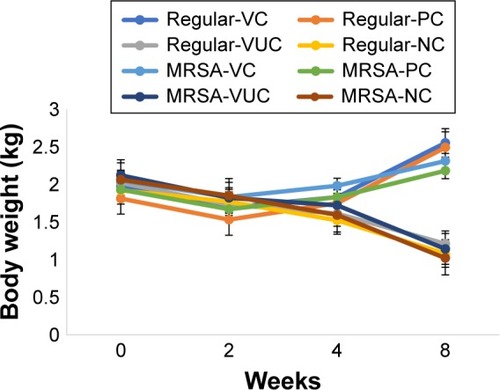
Figure 9 The change of venous WBC count.
Notes: Regular-VC referred to subgroup VC of regular S. aureus group, and so on. Comparison of WBC count between pretreatment and the end time: regular-VC: P=0.03; regular-PC: P=0.04; regular-VUC: P=0.008; regular-NC: P=0.005; MRSA-VC: P=0.02; MRSA-PC: P=0.04; MRSA-VUC: P=0.006; MRSA-NC: P=0.006.
Abbreviations: WBC, white blood cell; MRSA, methicillin-resistant Staphylococcus aureus; VC, vancomycin-loaded bone-like hydroxyapatite/poly amino acid group; VUC, bone-like hydroxyapatite/poly amino acid group; PC, vancomycin-loaded polymethyl meth acrylate group; NC, simulated body fluid group.
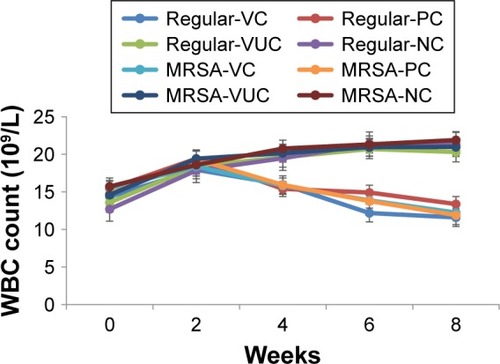
Table 2 The number of bone infection elimination cases (unit: cases, n=12)
Figure 10 Radiographic performance.
Notes: Regular-Pre means presurgery in the regular S. aureus group; the solid arrow (→) represents a bone defect; the arrowhead (⇨) represents reactive ossification; the swallowtail arrowhead (![]()
Abbreviations: MRSA, methicillin-resistant Staphylococcus aureus; VC, vancomycin-loaded bone-like hydroxyapatite/poly amino acid group; VUC, bone-like hydroxyapatite/poly amino acid group; PC, vancomycin-loaded polymethyl methacrylate group; NC, simulated body fluid group.
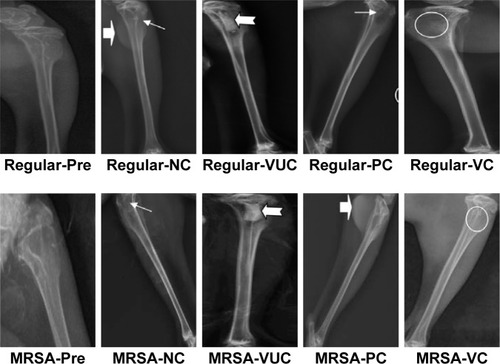
Figure 11 Radiographic score before and after treatment.
Notes: Comparison of Norden scores between before and after treatment: regular-VC: P=0.003, regular-PC: P=0.003, regular-VUC: P=0.10, regular-NC: P=0.11, MRSA-VC: P=0.005, MRSA-PC: P=0.009, MRSA-VUC: P=0.14, MRSA-NC: P=0.12; Comparison among subgroups after treatment: regular-VC vs regular-PC and MRSA-VC vs MRSA-PC: P=0.03; regular-VC vs regular-VUC, regular-VC vs regular-NC, MRSA-VC vs MRSA-VUC and MRSA-VC vs MRSA-NC: P=0.003; regular-PC vs regular-VUC, regular-PC vs regular-NC, MRSA-PC vs MRSA-VUC and MRSA-PC vs MRSA-NC: P=0.007; regular-VUC vs regular-NC and MRSA-VUC vs MRSA-NC: P=0.08, No statistical difference in corresponding subgroups between regular group and MRSA group (P>0.05).
Abbreviations: MRSA, methicillin-resistant Staphylococcus aureus; VC, vancomycin-loaded bone-like hydroxyapatite/poly amino acid group; VUC, bone-like hydroxyapatite/poly amino acid group; PC, vancomycin-loaded polymethyl meth-acrylate group; NC, simulated body fluid group.
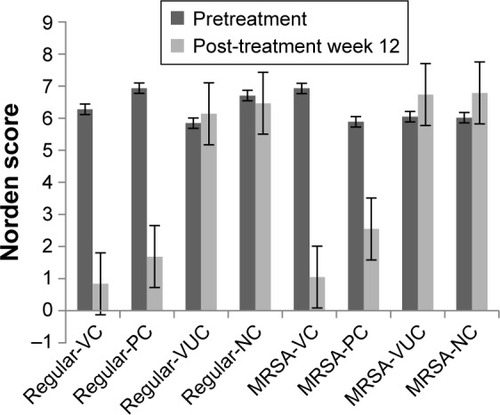
Figure 12 Histological performance (H&E staining, ×100).
Notes: Regular-Pre means presurgery in the regular S. aureus group; the solid arrow (➔) indicates inflammatory cell infiltration; the arrowhead (![]()
Abbreviations: H&E, hematoxylin and eosin; MRSA, methicillin-resistant Staphylococcus aureus; VC, vancomycin-loaded bone-like hydroxyapatite/poly amino acid group; VUC, bone-like hydroxyapatite/poly amino acid group; PC, vancomycin-loaded polymethyl methacrylate group; NC, simulated body fluid group.
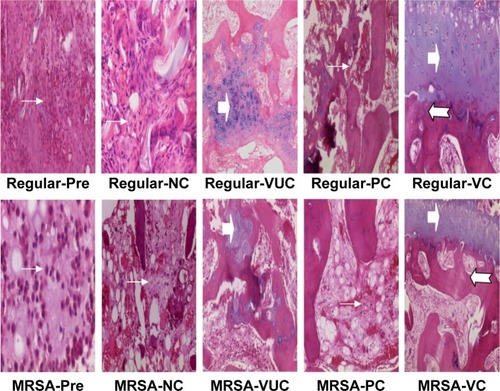
Figure 13 Histological score before and after treatment.
Notes: Pre means pretreatment. Comparison of histological scores between before and after treatment: regular-VC: P<0.001, regular-PC: P=0.03, regular-VUC: P=0.14, regular-NC: P=0.16, MRSA-VC: P<0.001, MRSA-PC: P=0.02, MRSA-VUC: P=0.31, MRSA-NC: P=0.52; Comparison among subgroups after treatment: regular-VC vs regular-PC and MRSA-VC vs MRSA-PC: P=0.03; regular-VC vs regular-VUC, regular-VC vs regular-NC, MRSA-VC vs MRSA-VUC and MRSA-VC vs MRSA-NC: P=0.009; regular-PC vs regular-VUC, regular-PC vs regular-NC, MRSA-PC vs MRSA-VUC and MRSA-PC vs MRSA-NC: P=0.04; regular-VUC vs regular-NC and MRSA-VUC vs MRSA-NC: P=0.17, No statistical difference in corresponding subgroups between regular group and MRSA group (P>0.05).
Abbreviations: MRSA, methicillin-resistant Staphylococcus aureus; VC, vancomycin-loaded bone-like hydroxyapatite/poly amino acid group; VUC, bone-like hydroxyapatite/poly amino acid group; PC, vancomycin-loaded polymethyl methacrylate group; NC, simulated body fluid group.
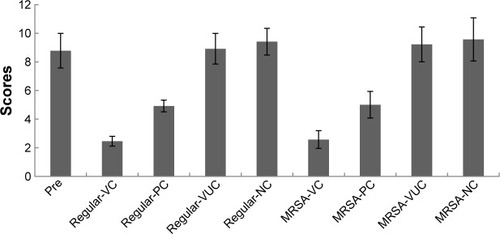
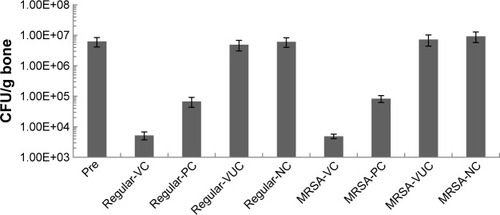
Figure 14 Bacterial load per gram bone.
Notes: Pre means pretreatment. Comparison of bacterial load between before and after treatment: regular-VC: P<0.001, regular-PC: P=0.04, regular-VUC: P=0.21, regular-NC: P=0.35, MRSA-VC: P<0.001, MRSA-PC: P=0.03, MRSA-VUC: P=0.19, MRSA-NC: P=0.16; Comparison among subgroups after treatment: regular-VC vs regular-PC and MRSA-VC vs MRSA-PC: P=0.03; regular-VC vs regular-VUC, regular-VC vs regular-NC, MRSA-VC vs MRSA-VUC and MRSA-VC vs MRSA-NC: P=0.006; regular-PC vs regular-VUC, regular-PC vs regular-NC, MRSA-PC vs MRSA-VUC and MRSA-PC vs MRSA-NC: P=0.03; regular-VUC vs regular-NC and MRSA-VUC vs MRSA-NC: P=0.15, No statistical difference in corresponding subgroups between regular group and MRSA group (P>0.05).
Abbreviations: MRSA, methicillin-resistant Staphylococcus aureus; VC, vancomycin-loaded bone-like hydroxyapatite/poly amino acid group; VUC, bone-like hydroxyapatite/poly amino acid group; PC, vancomycin-loaded polymethyl methacrylate group; NC, simulated body fluid group.