Figures & data
Figure 1 Chemical structure of the cholesteryl esters used in the making of the nanoemulsions: A) Cholesteryl oleate (18:1). B) Cholesteryl linoleate (18:2). C) Cholesteryl stearate (18:0).
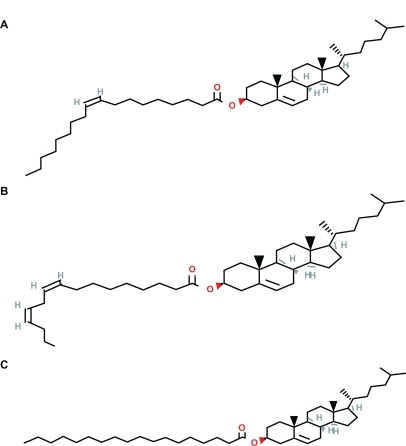
Figure 2 Stability of the three different nanoemulsions, CO (circles), CL (triangles), and CS (squares), as observed during 237 days, in respect to a) size, b) polydispersity, c) pH, and d) lipid peroxidation evaluated by the TBARS method. Data are expressed as means ± SD of two samples.
Abbreviations: CO, cholesteryl oleate; CL, cholesteryl linoleate; CS, cholesteryl stearate; SD, standard deviation; TBARS, thiobarbituric acid reactive substances.
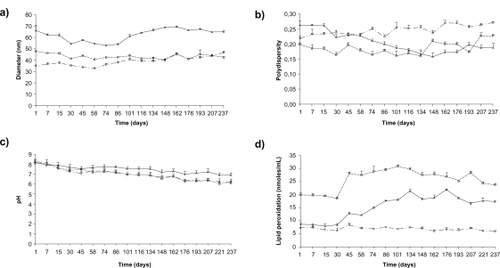
Figure 3 Lipid peroxidation measured by the TBARS method in incubates of a) HUVEC, b) fibroblasts, c) monocytes, d) macrophages, and e) H292 cells with increasing concentrations of CO (circles), CL (triangles), and CS (squares) nanoemulsions. Lipid peroxidation was measured in 100 μL of the culture media after four hours of incubation. Control corresponds to point zero, in which there was no addition of nanoemulsion to the cells. Data are expressed as means ± SD of three experiments.
Abbreviations: CO, cholesteryl oleate; CL, cholesteryl linoleate; CS, cholesteryl stearate; SD, standard deviation; TBARS, thiobarbituric acid reactive substances; HUVEC, human umbilical vein endothelial cells.
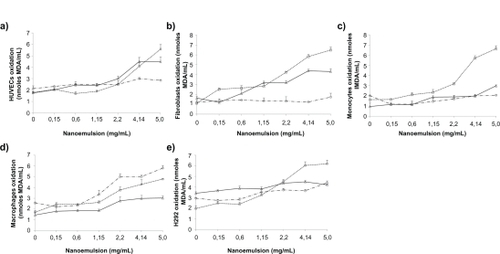
Figure 4 Uptake by a) HUVEC, b) fibroblasts, c) monocytes, d) macrophages, and e) H292 cells of increasing amounts of CO (circles), CL (triangles), and CS (squares) after four hours of incubation of radioactively labeled nanoemulsions with the cultured cells at 37°C. Data are expressed as means ± SD of three experiments.
Abbreviations: CO, cholesteryl oleate; CL, cholesteryl linoleate; CS, cholesteryl stearate; SD, standard deviation; HUVEC, human umbilical vein endothelial cells.
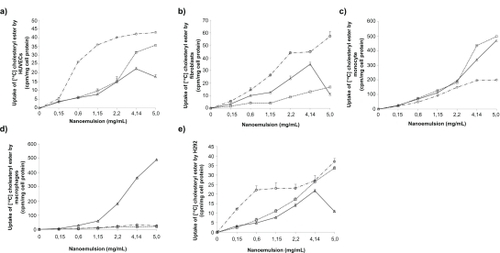
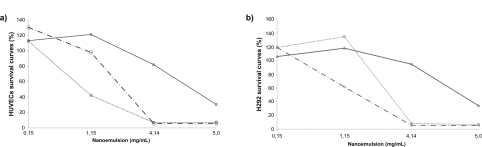
Figure 5 Survival curves of a) HUVEC and b) H292 cells 24 hours after incubation with CO (circles), CL (triangles), and CS (square) nanoemulsions, as evaluated by the MTT method. Data are expressed as means ± SD of three experiments.
Abbreviations: CO, cholesteryl oleate; CL, cholesteryl linoleate; CS, cholesteryl stearate; SD, standard deviation; HUVEC, human umbilical vein endothelial cells.