Figures & data
Table 1 The hydrodynamic size and zeta potential of SiNPs in distilled water and DMEM at different time points
Figure 1 Characterization of SiNPs.
Notes: (A) The morphology of SiNPs is characterized by TEM. Scale bar, 100 nm. (B) Size distribution histograms were obtained by ImageJ software. The average diameter was 58.4±7.4 nm.
Abbreviations: SD, standard deviation; SiNPs, silica nanoparticles; TEM, transmission electron microscopy.
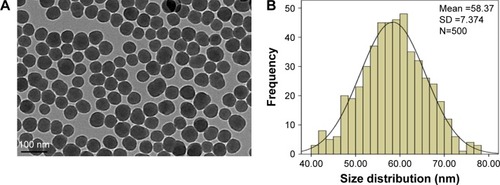
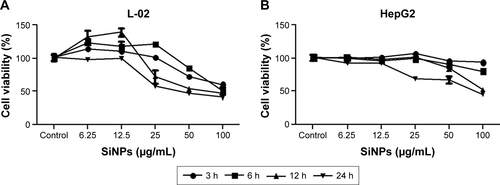
Figure 2 Cellular uptake of SiNPs and cell viability of L-02 and HepG2 after exposure to SiNPs.
Notes: (A) TEM images of L-02 and HepG2 cells with 50 μg/mL SiNP treatment for 24 h. There were no SiNPs observed in controls and the cellular structures were unchanged (a and d). Electron-dense SiNPs were dispersed in cytoplasm, LYs, and autophagic vacuoles in 50 μg/mL SiNP-treated cells (b and e). The magnification view of the selected area showed LYs (black arrows) and autophagic vacuoles (white arrows) containing aggregated SiNPs. Scale bars: 1 μm (a, c, d, and f); 2 μm (b and e). Magnification: a, 2,500×; b, 1,200×; c, 6,000×; d, 6,000×; e, 4,000×; f, 1,000×. (B and C) Cell viability was analyzed by CCK-8. L-02 and HepG2 cells were treated with different doses of SiNPs (6.25, 12.5, 25, 50, and 100 μg/mL) for indicated time points (3, 6, 12, and 24 h). Data are expressed as mean ± SD. *P<0.05 compared with control.
Abbreviations: Av, autophagic vacuoles; CCK-8, Cell Counting Kit-8; LYs, lysosomes; N, nucleus; SD, standard deviation; SiNPs, silica nanoparticles; TEM, transmission electron microscopy.
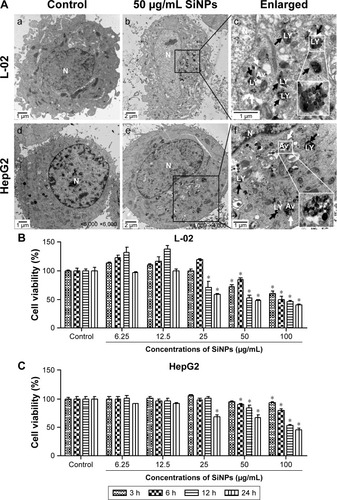
Figure 3 SiNPs induced autophagosome accumulation in L-02 and HepG2 cells.
Notes: (A) TEM images showed autophagosome accumulation in L-02 (a, b, c) and HepG2 cells (d, e, f) with SiNP treatment. a,d: untreated control cells; b,e: cells treated with 50 μg/mL SiNP for 24 h; c,f: the enlarged autophagosome or autolysosome. Black arrow, double-membrane autophagosome; white arrow, single-membrane autolysosome. Magnification: a, 8,000×; b, 6,000×; c, 30,000×; d, 12,000×; e, 12,000×; f, 60,000×. (B) After treatment with different doses of SiNPs (12.5, 25, and 50 μg/mL) for 24 h, the cells were fixed and analyzed by indirect immunofluorescence using anti-LC3B. Distribution patterns of cytoplasmic LC3B in control and SiNP-treated cells were visualized with LSCM, and the selected areas were magnified. LC3B (green) and DAPI staining of nuclei (blue) is shown. Quantification represents the number of punctate LC3B per cell in untreated control and SiNP-treated cells. Data are expressed as mean ± SD. *P<0.05 compared with control.
Abbreviations: DAPI, 4′,6-diamidino-2-phenylindole; LSCM, laser scanning confocal microscope; N, nucleus; SD, standard deviation; SiNPs, silica nanoparticles; TEM, transmission electron microscopy.
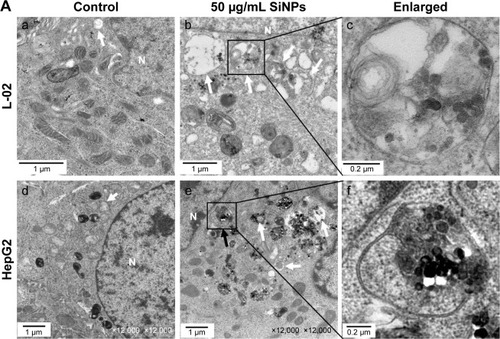
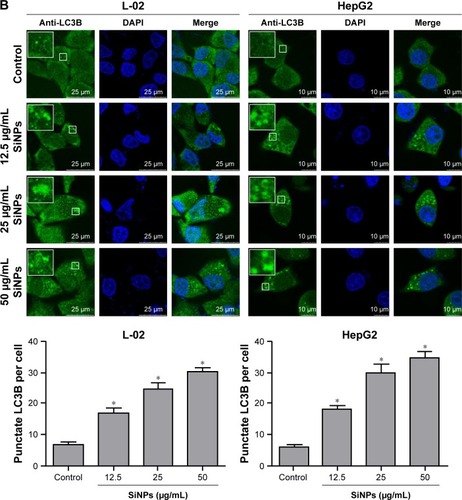
Figure 4 The conversion of LC3B-I to LC3B-II and p62 degradation after SiNP treatment was analyzed using Western blot.
Notes: (A, B) L-02 and HepG2 cells were treated with different concentrations of SiNPs (6.25, 12.5, 25, 50, and 100 μg/mL) for 24 h. (C, D) L-02 and HepG2 cells were treated with 50 μg/mL SiNPs for different time points (3, 6, 12, and 24 h). At the indicated time point, cells were harvested and the expressions of LC3B and p62 were analyzed by Western blot. Blots are representative of the three independent experiments. β-Actin was used as sample-loading control. Densitometric LC3B-II/β-actin and p62/β-actin ratios from at least three independent experiments are shown. The value of control without any treatment was set at 1 for each experiment (*P<0.05).
Abbreviation: SiNPs, silica nanoparticles.
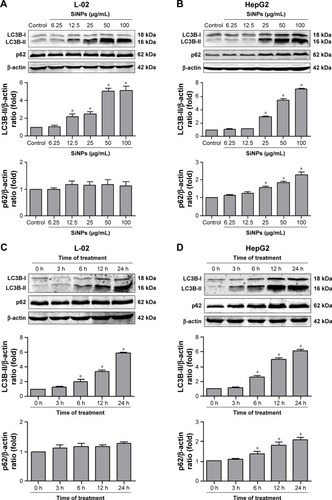
Figure 5 SiNPs inhibited autophagic flux in L-02 and HepG2 cells.
Notes: (A) L-02 or HepG2 cells were pretreated with (+) or without (−) 10 nM BafA1 for 2 h; then, the cells were treated with different concentrations of SiNPs (12.5, 25, 50, and 100 μg/mL) for 24 h. Cells were harvested and the expressions of LC3B and p62 were analyzed by Western blot. Blots are representative of the three independent experiments. β-Actin was used as sample-loading control. Densitometric LC3B-II/β-actin and p62/β-actin ratios from at least three independent experiments are shown. The value of control without any treatment was set at 1 for each experiment (*P<0.05). (B) L-02 or HepG2 cells were transfected with mTagRFP-mWasabi-LC3B plasmids for 24 h; the cells were pretreated with (+) or without (−) BafA1 (10 nM) for 2 h, and then treated with 50 μg/mL SiNPs for additional 24 h. The distribution of mTagRFP-mWasabi-LC3B was observed using LSCM. Yellow punctate structures indicate autophagosomes; red punctate structures indicate autolysosomes. Scale bars: 10 μm.
Abbreviations: BafA1, bafilomycin A1; DAPI, 4′,6-diamidino-2-phenylindole; LSCM, laser scanning confocal microscope; NS, not significant; SiNPs, silica nanoparticles.
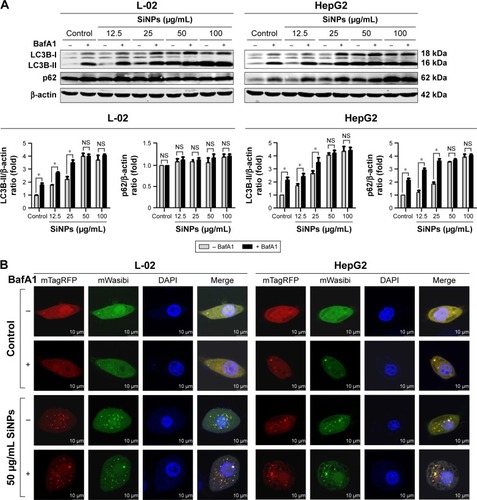
Figure 6 SiNPs blocked autophagic flux through impairing lysosomes.
Notes: (A) TEM images showed that SiNPs were accumulated in lysosomes (black arrows), causing swelling of lysosomes even when broken after SiNP exposure in both L-02 and HepG2 cells. Images of untreated control group showed the smaller intact lysosomes (black arrows). The selected areas were magnified. Scale bars, 0.5 μm. (B) AO staining was performed to evaluate the integrity of the lysosomal membrane in L-02 and HepG2 cells after exposure to SiNPs. Green fluorescence was acquired with excitation at 485 nm and emission at 530 nm; red fluorescence was acquired with excitation at 485 nm and emission at 620 nm using LSCM. Scale bars, 25 μm. The ratio of red and green fluorescence was calculated by Columbus software (*P<0.05).
Abbreviations: AO, acridine orange; BafA1, bafilomycin A1; LSCM, laser scanning confocal microscope; SiNPs, silica nanoparticles; TEM, transmission electron microscopy.
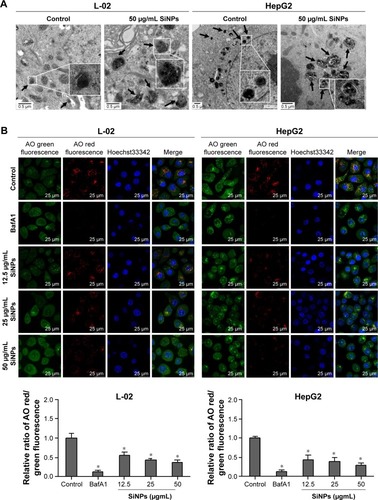
Figure 7 SiNPs downregulated lysosomal cathepsin expression.
Notes: (A) L-02 and HepG2 cells were treated with different concentrations of SiNPs (6.25, 12.5, 25, 50, and 100 μg/mL) for 24 h. Cells were harvested and the expressions of CTSB and CTSD were analyzed by Western blot. Blots are representative of the three independent experiments. β-Actin was used as sample-loading control. Densitometric CTSB/β-actin and CTSD/β-actin ratios from at least three independent experiments are shown. The value of control without any treatment was set at 1 for each experiment (*P<0.05). (B) Relative CTSB and CTSD mRNA levels (compared with GAPDH) were analyzed by quantitative RT-PCR. L-02 and HepG2 cells were treated with SiNPs (12.5, 25, and 50 μg/mL) for 24 h. Cells were harvested, and quantitative RT-PCR was performed. Data are representative of three independent experiments (*P<0.05).
Abbreviations: CTSB, cathepsin B; CTSD, cathepsin D; RT-PCR, reverse transcription-polymerase chain reaction; SiNPs, silica nanoparticles.
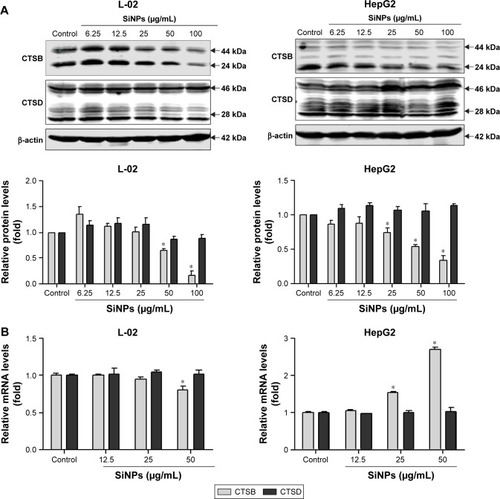
Figure 8 Schematic model of the underlying mechanism of autophagy dysfunction induced by SiNPs.
Notes: SiNPs can be endocytosed into L-02 and HepG2 cells and trigger autophagy through ROS. Moreover, SiNPs were largely deposited in lysosomes and impaired lysosomal function through destroying lysosomal ultrastructures, increasing membrane permeability, and downregulating the expression of lysosomal proteases. Eventually, SiNPs blocked the autophagic flux and caused autophagy dysfunction.
Abbreviations: CTSB, cathepsin B; ROS, reactive oxygen species; SiNPs, silica nanoparticles.
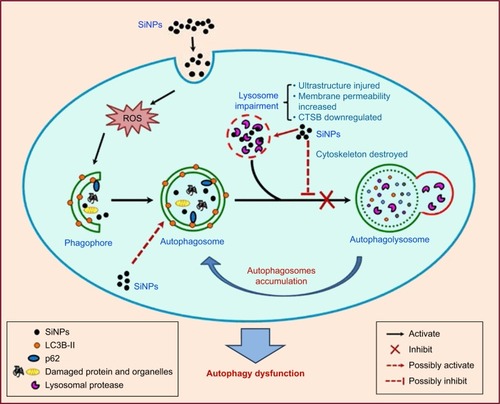
Figure S1 Cell viability of L-02 and HepG2 after exposure to SiNPs.
Notes: (A, B) Cell viability were analyzed by Cell Counting Kit-8 (CK04-1000; Dojindo, Mashiki-machi, Japan). L-02 and HepG2 cells were treated with different doses of SiNPS (6.25, 12.5, 25, 50, and 100 μg/mL) for an indicated time (3, 6, 12, and 24 h). Data are expressed as mean ± standard deviation.
Abbreviation: SiNPs, silica nanoparticles.