Figures & data
Figure 1 TEM image of nanoparticles manufactured by electric non-explosive method: a) gold b) platinum.
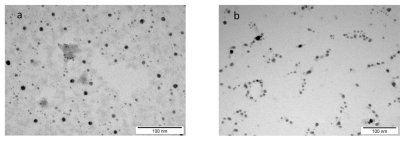
Figure 2 TEM image of Salmonella Enteritidis and gold (Au) nanoparticles: a) control; b, c, and d) Salmonella Enteritidis with Au nanoparticles. Arrows point to nano-Au.
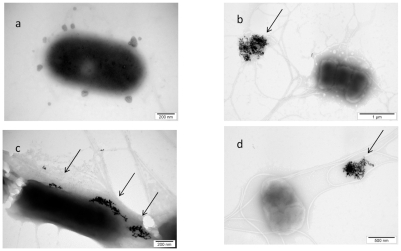
Figure 3 TEM image of Listeria monocytogenes and gold (Au) nanoparticles: a) control; b, c, and d) Listeria monocytogenes with Au nanoparticles. Arrows point to nano-Au (b and d); and to aglomerate of nano-Au (c).
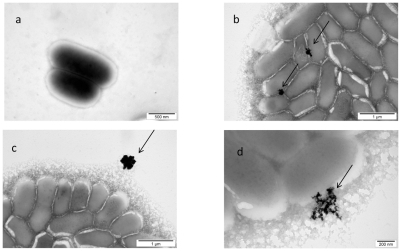
Figure 4 TEM image of Salmonella Enteritidis and platinum (Pt) nanoparticles: a) control; b, c, and d) the same cell of Salmonella Enteritidis with Pt nanoparticles. Arrows point to nano-Pt (b); and the spots observed with increasing magnification (b, c, and d). Black spots are seen evaporating under the microscope electron beam and are finally seen as white spots.
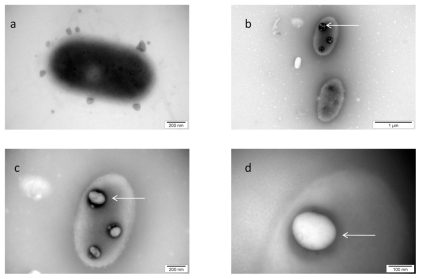
Figure 5 TEM image of Listeria monocytogenes and platinum (Pt) nanoparticles: a) control; b, c, and d) Listeria monocytogenes with nano-Pt. Arrows point to nano-PT (b and c); and to black spot partially evaporated under microscope electron beam (b).
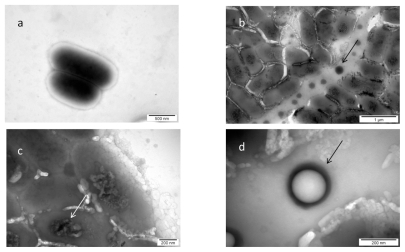
Figure 6 TEM image of Salmonella Enteritidis and platinum (Pt) nanoparticles, after washing and centrifugation to remove nanoparticles unattached to bacteria: a) control; b, c, and d) Salmonella Enteritidis with nano-Pt. Arrows point to nano-Pt complexes.
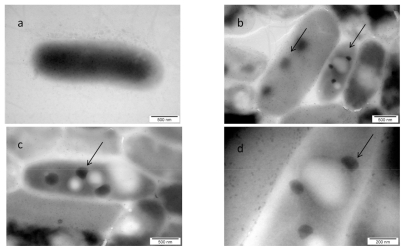
Figure 7 Confocal microscope image of Salmonella Enteritidis: 1) control; 2, 3, and 4) after incubation with platinum nanoparticles for 45, 60, and 90 min respectively. a) Nomarski contrast; b) stained with DAPI; and c) merged pictures.
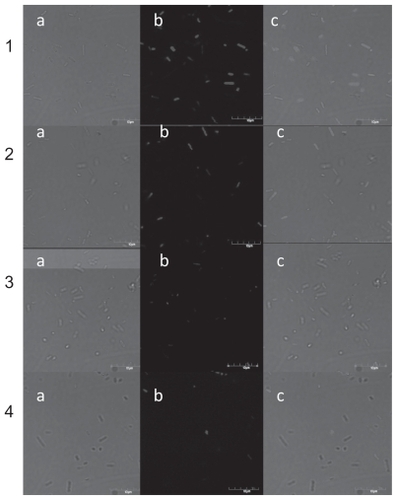
Table 1 Average number and viability of Salmonella Enteritidis incubated with nano-Pt for 45, 60, and 90 min. DNA visualization was performed by labelling bacteria with DAPI (DNA-binding fluorochrome)