Figures & data
Table 1 Composition of AgNPs hydrogels (500 µg AgNPs/g hydrogel). AgNPs were coated with 5 mM PEG 6000, 10 mM PEG 6000, 5 mM SDS, and 5 mM β-CD, and AgNPs-loaded hydrogels were prepared using various polymers (Na CMC, Na alginate, HPMC, Pluronic F-127, and chitosan)
Figure 1 Graphical chart represents the design of the study on the in vivo antibacterial activity of AgNPs.
Abbreviations: AgNPs, silver nanoparticles; IP, intraperitoneal; CFU, colony-forming units; MRSA, methicillin-resistant Staphylococcus aureus; Na CMC, sodium carboxymethyl cellulose.
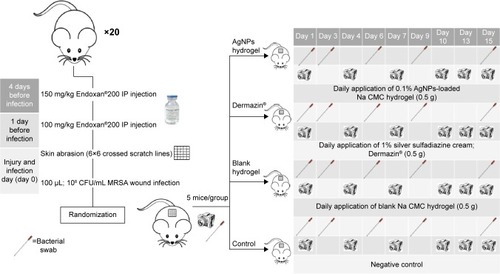
Table 2 Characterizations of the AgNPs dispersions in terms of size, PDI, and zeta-potential. Size was measured by using DLS and TEM
Figure 2 UV–visible spectrophotometric spectra of AgNPs dispersions: (1) 5 mM PEG-coated AgNPs; (2) 10 mM PEG-coated AgNPs; (3) 5 mM SDS-coated AgNPs; (4) 10 mM SDS-coated AgNPs; (5) 5 mM β-CD-coated AgNPs; (6) 10 mM β-CD-coated AgNPs; and (7) uncoated AgNPs and their solutions without AgNPs (blank solutions).
Abbreviations: AgNPs, silver nanoparticles; PEG, polyethylene glycol; SDS, sodium dodecyl sulfate; β-CD, β-cyclodextrin; UV, ultraviolet.
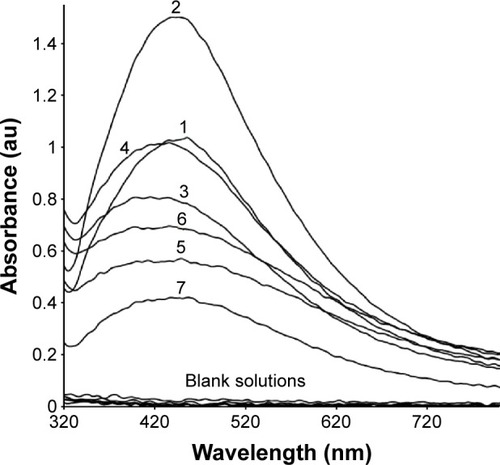
Figure 3 Representative TEM micrographs for the aqueous dried AgNPs (100 µg AgNPs/mL): (A) uncoated AgNPs; (B) SDS-coated AgNPs; (C) PEG-coated AgNPs (×100,000); (D) β-CD-coated AgNPs (×140,000) with sizes =15.7±4.8, 13±4, 19.2±3.6, and 14±4.4 nm, respectively (n=50, bar represents 100 nm). Insets indicate histograms of AgNPs size distribution.
Abbreviations: TEM, transmission electron microscopy; AgNPs, silver nanoparticles; SDS, sodium dodecyl sulfate; PEG, polyethylene glycol; β-CD, β-cyclodextrin.
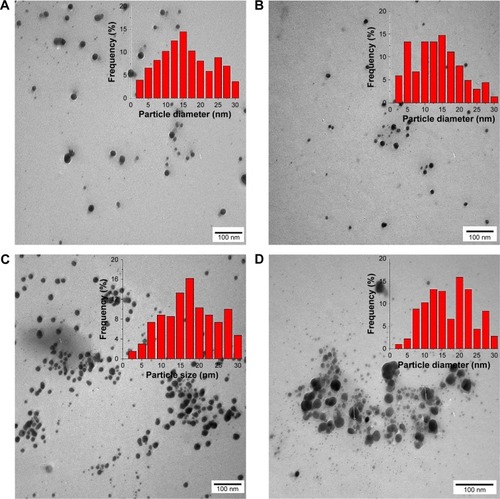
Figure 4 Effect of coating type on AgNPs (500 µg AgNPs/mL) sedimentation rate in water over time: (a) 5 mM PEG-coated AgNPs; (b) 10 mM PEG-coated AgNPs; (c) 5 mM SDS-coated AgNPs; (d) 10 mM SDS-coated AgNPs; (e) 5 mM β-CD-coated AgNPs; (f) 10 mM β-CD-coated AgNPs; and (g) uncoated AgNPs.
Abbreviations: AgNPs, silver nanoparticles; PEG, polyethylene glycol; SDS, sodium dodecyl sulfate; β-CD, β-cyclodextrin.
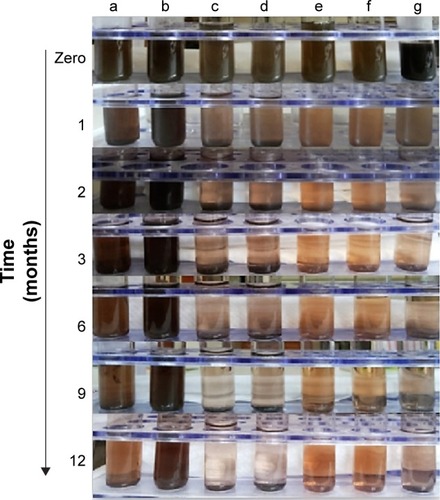
Table 3 MIC and MBC of AgNPs dispersions against MSSA, MRSA, and Escherichia coli determined using microtiter plate method. Statistical data indicate the effect of bacterial type on the MIC/MBC of the prepared AgNPs, either uncoated or coated with various materials, regardless of the coating type
Table 4 Determination of inhibition zones for different AgNPs dispersions against MSSA, MRSA, and Escherichia coli using agar-well diffusion method. Statistical data indicate the main effects of bacterial type on the inhibition zones, regardless of the coating type, and the main effects of coating agents, regardless of the bacterial type
Figure 5 Bacterial inhibition zones of AgNPs-loaded hydrogels against MSSA, MRSA, and Escherichia coli using agar-well diffusion method, where F1–F5, F6–F10, F11–F15, F16–F20, and F21–F25 are Na CMC, Na alginate, HPMC, Pluronic F-127, and chitosan hydrogels loaded with AgNPs, respectively.
Abbreviations: AgNPs, silver nanoparticles; MSSA, methicillin-sensitive Staphylococcus aureus; MRSA, methicillin-resistant S. aureus; Na CMC, sodium carboxymethyl cellulose; Na alginate, sodium alginate; HPMC, hydroxypropylmethyl cellulose.
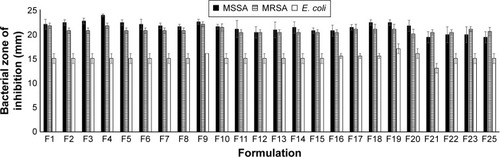
Figure 6 Percent of wound contraction in rats during the 10 d of treatment. Hydrogel loaded with 0.1% AgNPs (circles) was compared to 1% silver sulfadiazine cream (squares).
Abbreviation: AgNPs, silver nanoparticles.
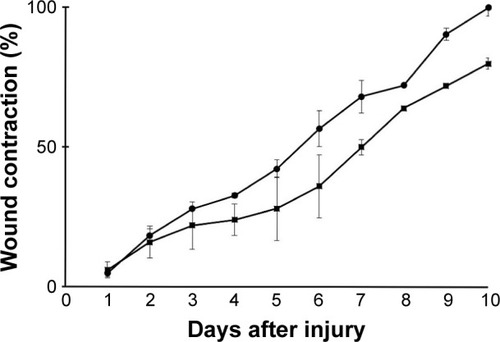
Figure 7 Successive images of representative mice skin abrasion wounds infected with MRSA at different time intervals. Two groups were treated with 0.1% AgNPs hydrogel and 1% silver sulfadiazine cream. The two other groups were the blank hydrogel-treated group and control untreated mice.
Abbreviations: MRSA, methicillin-resistant Staphylococcus aureus; AgNPs, silver nanoparticles.
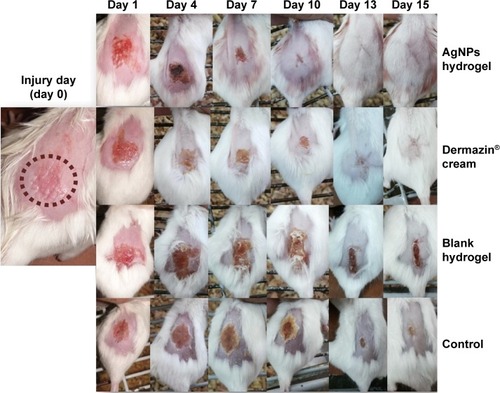
Figure 8 Bacterial count in the infected abrasion wounds of different mice groups at different time intervals expressed as percentages of the bacterial counts in the control untreated mice group. The studied groups are 0.1% AgNPs hydrogel-treated group, 1% silver sulfadiazine cream-treated group, and blank hydrogel-treated group.
Abbreviation: AgNPs, silver nanoparticles.
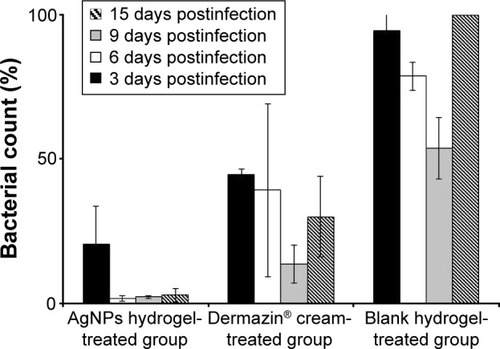
Table 5 Mortality and morbidity observed at the end of the study in the MRSA-infected mice groups
Figure 9 Light microscopy images of representative skin samples (stained with hematoxylin and eosin) (×400) after 15 d of treatment: (A) 0.1% AgNPs hydrogel-treated group; (B) 1% silver sulfadiazine cream-treated group; (C) blank hydrogel-treated group; and (D) control group (untreated mice). Arrows refer to lymphocytes. C, G, S, D, and E represent stratum corneum, stratum granulosum, stratum spinosum, dermis, and epidermis, respectively.
Abbreviation: AgNPs, silver nanoparticles.
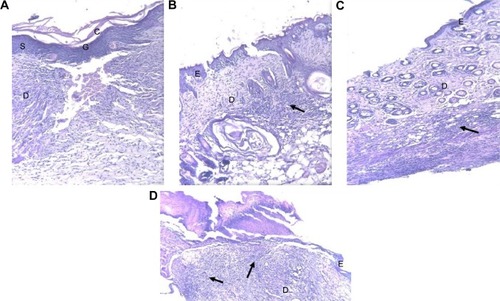
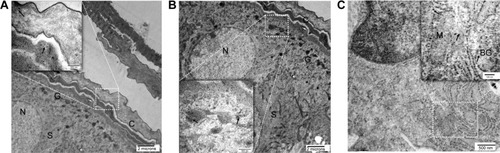
Figure 10 Transmission electron micrographs: (A) epidermal layers with magnification of stratum corneum; (B) epidermal layers with magnification of stratum granulosum (×4,800, inset: ×29,000), (C) Langerhans cell in stratum spinosum (×19,000, inset: ×72,000). Inset arrows indicate localized AgNPs. C, G, S, N, BG, and M represent stratum corneum, stratum granulosum, stratum spinosum, nucleus, Birbeck granules, and mitochondria, respectively.
Abbreviation: AgNPs, silver nanoparticles.