Figures & data
Figure 1 Effects of TAT-PtBP-Pt on the lifespan of N2 and LB25. Adult nematodes were treated with 5 μM TAT-PtBP-Pt for days 0–10. Shown are survival curves of untreated control (•) and treated (○) worms A). The number of worms was 90–95 in each experiment, and three independent experiments were repeated. The mean lifespan B) was calculated from survival curves. The concentration of Pt in TAT-PtBP-Pt was varied up to 25 μM. Effect of the fusion protein (TAT-PtBP) at 25 μM alone on the lifespan of nematodes was also studied. Error bars represent the standard error of the mean.
Notes: **P < 0.01; ***P < 0.001, as compared with control worms by the log-rank test. The lifespan data are summarized in the .
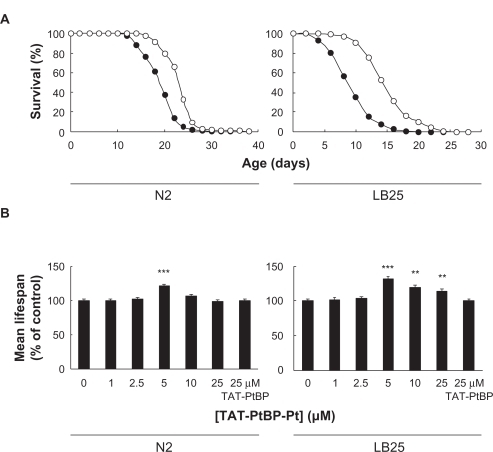
Table 1 Effects of TAT-PtBP-Pt on the lifespan of C. elegans
Figure 2 Amount of Pt internalized in whole bodies and mitochondria of N2 and LB25. Animals were treated with 5 μM TAT-PtBP-Pt for five days from Day 0. Pt accumulation in worm whole bodies A) and mitochondria B) was determined by an inductively-coupled plasma mass spectrometer ICP-MS. For control, unconjugated Pt-nps (PVP-Pt) was used. The number of worms used was 100 and 500–508 in each measurement for whole bodies and mitochondria, respectively, and three independent experiments were repeated. Error bars represent the standard error of the mean.
Note: Statistical significance was determined by Student’s t-test (***P < 0.001).
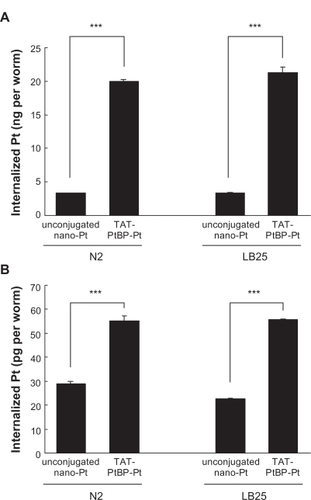
Figure 3 Effects of TAT-PtBP-Pt on cytosolic reactive oxygen species in N2 and LB25. Animals were treated with 5 μM TAT-PtBP-Pt for five days from Day 0. Worms were then treated with 10 μM CM-H2DCFDA for 30 minutes at 20°C. Fluorescence was measured by confocal florescence microscopy (Ex 488 nm and Em 510 nm). Shown is cytosolic reactive oxygen species in N2 and LB-25 whole bodies: A) control N2; B) treated N2; C) control LB25; D) treated LB25. The panel E) shows the average of relative intensity for three independent experiments with 10 worms per each experiment. Error bars represent the standard error of the mean.
Notes: *P < 0.05; **P < 0.01, as compared with control worms by Student’s t-test.
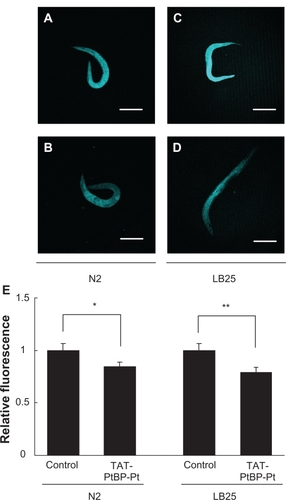
Figure 4 Effects of TAT-PtBP-Pt on O2− in N2 and LB mitochondria. Animals were cultured with TAT-PtBP-Pt for five days from Day 0. Worms were then treated with 10 μM MitoSOX for 30 minutes at 20°C. Fluorescence was measured by confocal florescence microscopy (Ex 510 nm and Em 580 nm). Shown is O2− in N2 and LB25 mitochondria: A) control N2; B) treated N2; C) control LB25; D) treated LB25. The panel E) shows the average of relative intensity for three independent experiments with 10 worms per each experiment. Error bars represent the SEM.
Notes: *P < 0.05; **P < 0.01, as compared with control worms by Student’s t-test.
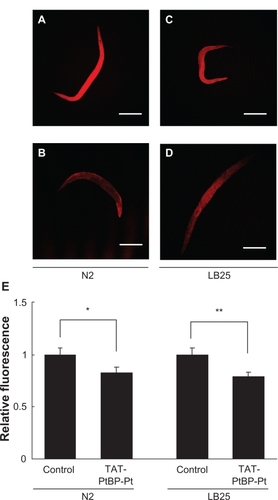
Figure 5 Effects of TAT-PtBP-Pt on the [NAD+]/[NADH] ratio in N2 and LB25. The concentrations of NAD+ and NADH were measured in whole bodies A) and mitochondria B) using an assay kit. The number of worms was 100 and 500 in each measurement for whole bodies and mitochondria, respectively, and three independent experiments were repeated. Error bars represent the standard error of the mean.
Note: ***P < 0.001 as compared with control worms by Student’s t-test.
![Figure 5 Effects of TAT-PtBP-Pt on the [NAD+]/[NADH] ratio in N2 and LB25. The concentrations of NAD+ and NADH were measured in whole bodies A) and mitochondria B) using an assay kit. The number of worms was 100 and 500 in each measurement for whole bodies and mitochondria, respectively, and three independent experiments were repeated. Error bars represent the standard error of the mean.Note: ***P < 0.001 as compared with control worms by Student’s t-test.](/cms/asset/f8d9c154-8d7d-44e7-a8a8-1643c10aab97/dijn_a_12184693_f0005_b.jpg)