Figures & data
Figure 1 Experimental setup for nonlinear measurements. L represents the lenses of the system, BM is a beam splitter, M1–M3 are mirrors, S is the sample, and PD1–PD4 are photodetectors with integrated filters.
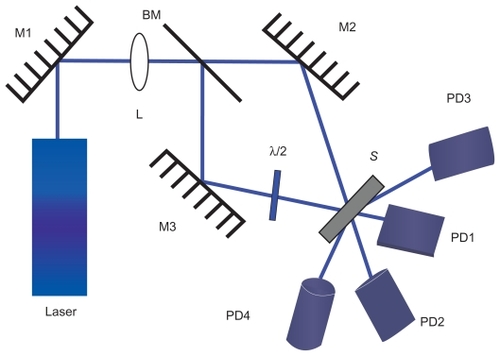
Figure 2 Experimental ablation setup. L represents the focusing system of lens, BM a beam splitter, S is the sample, and PDref is a reference photodetector with integrated filters.
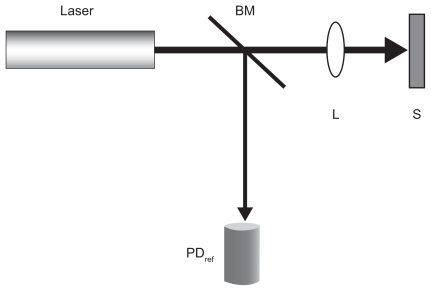
Figure 3 Self-diffraction efficiency at 355 nm and at 532 nm.
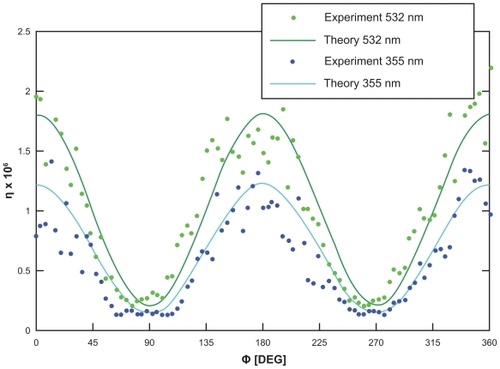
Figure 4 Linear absorption spectra after laser irradiation at different pulse durations and different wavelengths.
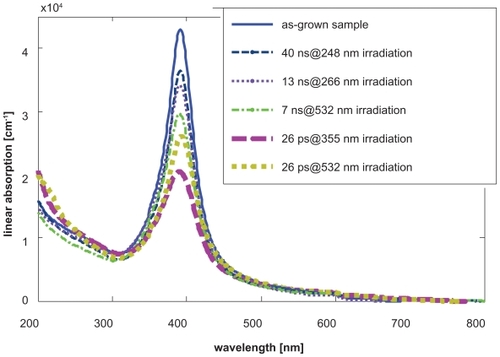
Table 1 Optical nonlinearities exhibited by the sample
Table 2 Ablation results