Figures & data
Figure 1 Schematic illustration of the BSA-Rh2 NPs synthesis and application mechanism for anticancer and anti-inflammatory efficacy.
Abbreviations: BSA, bovine serum albumin; NPs, nanoparticles.
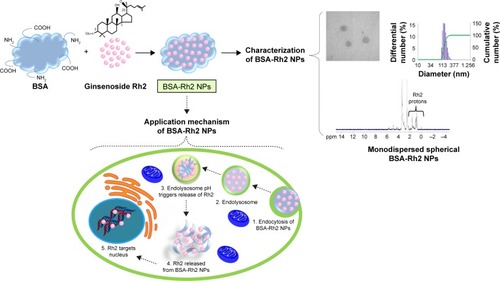
Figure 2 HPLC analysis of BSA-Rh2 NPs as compared with standard Rh2.
Abbreviations: BSA, bovine serum albumin; NPs, nanoparticles; HPLC, high-performance liquid chromatography.
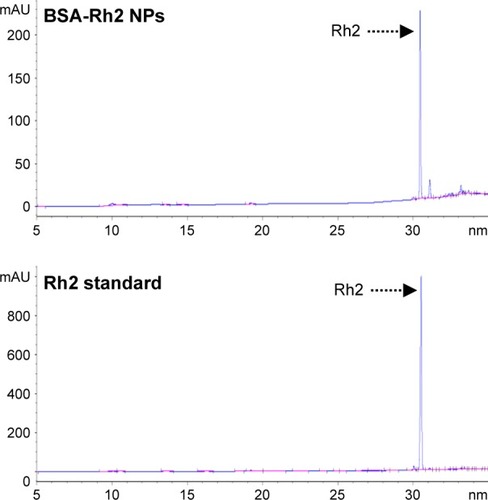
Figure 3 1H NMR analysis of BSA-Rh2 NPs (A), standard Rh2 (B) and standard BSA (C).
Abbreviations: BSA, bovine serum albumin; NPs, nanoparticles.
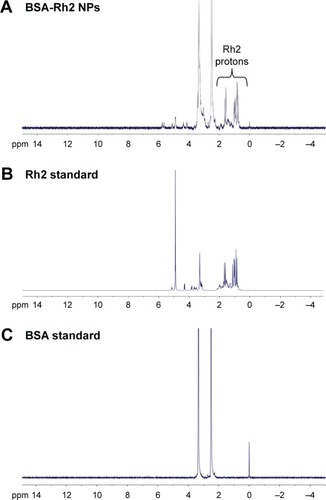
Figure 4 FT-IR pattern of BSA-Rh2 NPs corresponding to standard BSA.
Abbreviations: BSA, bovine serum albumin; NPs, nanoparticles.
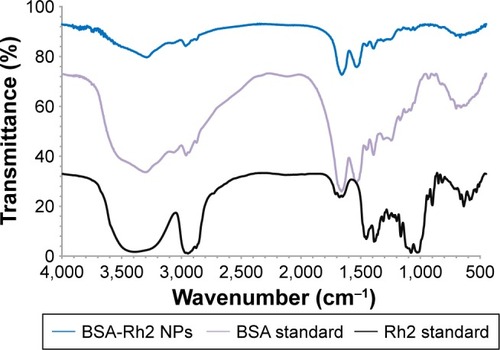
Figure 5 FE-TEM shape, morphology, SEAD and FFT characterization of BSA-Rh2 NPs.
Notes: Particles size at 200 nm (A), at 10 nm (B), FFT of NPs (C and D), SEAD pattern of NPs (E).
Abbreviations: FE-TEM, field-emission transmission electron microscope; SEAD, selected area (electron) diffraction; FFT, fast fourier transform; BSA, bovine serum albumin; NPs, nanoparticles.
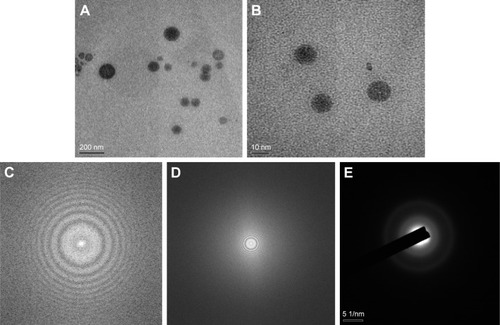
Figure 6 Characterizations of BSA-Rh2 NPs by particle size analysis (A), zeta potential analyzer (B), and TGA analysis (C), respectively.
Abbreviations: BSA, bovine serum albumin; NPs, nanoparticles.
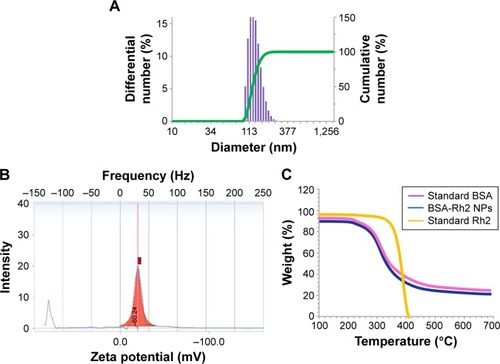
Figure 7 Time dependent stability of BSA-Rh2 NPs using particles size analysis, with respect to different time interval (A) and pH conditions (B).
Abbreviations: BSA, bovine serum albumin; NPs, nanoparticles.
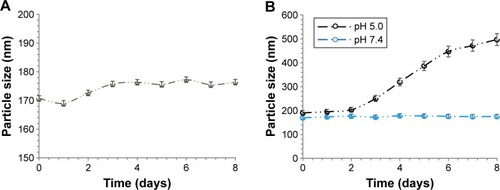
Figure 8 Solubility of free ginsenoside Rh2 and BSA-Rh2 NPs in water, their corresponding microscopic image and HPLC graph of supernatant, respectively.
Abbreviations: BSA, bovine serum albumin; HPLC, high-performance liquid chromatography; NPs, nanoparticles.
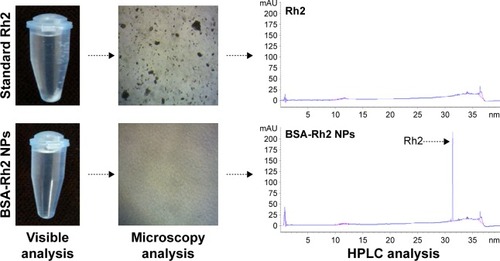
Figure 9 In vitro efficacy of BSA-Rh2 NPs, cell cytotoxicity in HaCaT skin cells (A), A549 lung cancer cell lines (B), HT29 colon cancer cells (C), Hoechst 33258 staining in A549 cells (D), and HT29 colon cancer cells (E).
Notes: Apoptotic cells are indicated with yellow arrows, Scale bar, 10 μm. Data shown represent the mean values of three experiments ± SD. *P<0.05, **P<0.01, ***P<0.001 vs control.
Abbreviations: BSA, bovine serum albumin; NPs, nanoparticles.
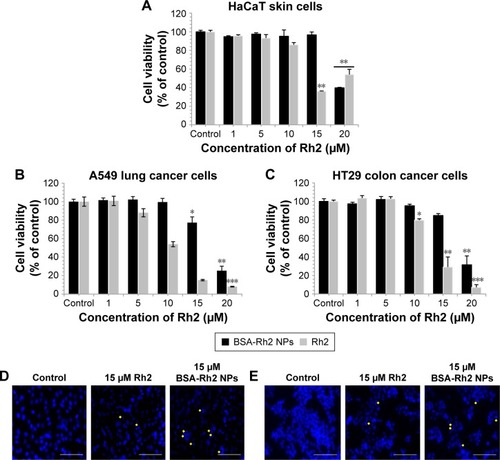
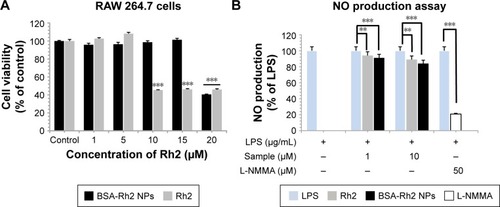
Figure 10 In vitro efficacy of BSA-Rh2 NPs, in RAW 264.7 (murine macrophage) cell lines (A) and inhibition of LPS induced NO production assay (B).
Note: Data shown represent the mean values of three experiments ± SD. **P<0.01, ***P<0.001 vs control.
Abbreviations: BSA, bovine serum albumin; LPS, lipopolysaccharide; NO, nitric oxide; NPs, nanoparticles.