Figures & data
Figure 1 Powder X-ray diffraction patterns of iron oxide magnetic nanoparticles (A), PTA-CS-MNP nanocomposite (B), and phytic acid sodium salt (C).
Abbreviation: PTA-CS-MNP, phytic acid-chitosan-iron oxide nanocomposite.
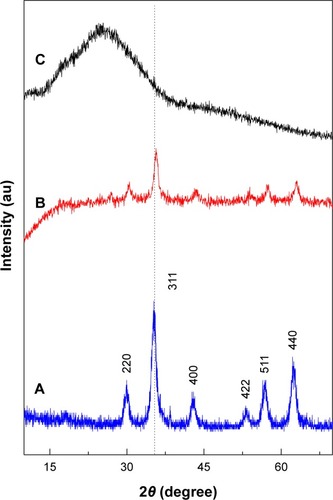
Figure 2 Fourier transform infrared spectra of iron oxide magnetic nanoparticles (A), PTA-CS-MNP nanocomposite (B), and phytic acid sodium salt (C).
Abbreviation: PTA-CS-MNP, phytic acid-chitosan-iron oxide nanocomposite.
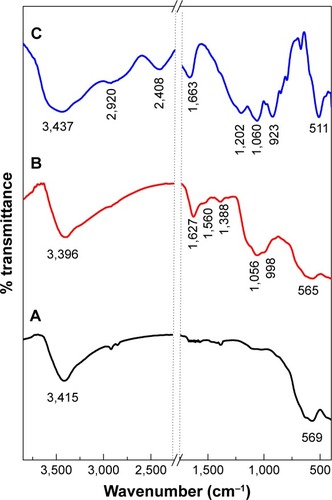
Figure 3 Schematic representation of the interaction between iron oxide magnetic nanoparticles, chitosan (A), and phytic acid (B) in the PTA-CS-MNP nanocomposite.
Abbreviation: PTA-CS-MNP, phytic acid-chitosan-iron oxide nanocomposite.
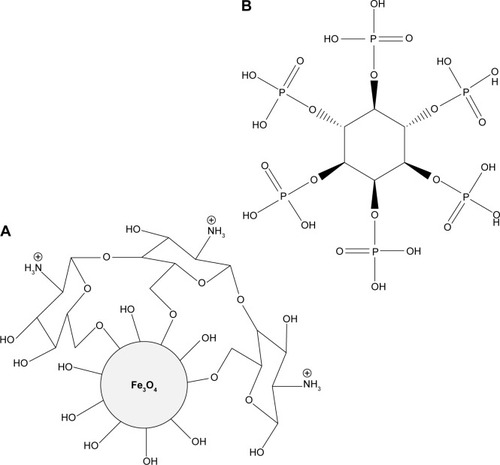
Figure 4 TGA/DTG thermograms of phytic acid sodium salt (A), iron oxide magnetic nanoparticles (B), and PTA-CS-MNP nanocomposite (C).
Abbreviations: PTA-CS-MNP, phytic acid-chitosan-iron oxide nanocomposite; TGA/DTG, thermogravimetric and differential thermogravimetric analyses.
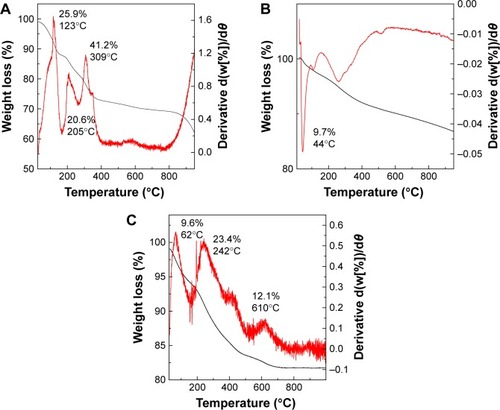
Figure 5 Magnetization curves of iron oxide magnetic nanoparticles (A) and phytic acid-loaded chitosan-iron oxide magnetic nanoparticles (B) recorded at room temperature.
Abbreviation: Oe, oersted.
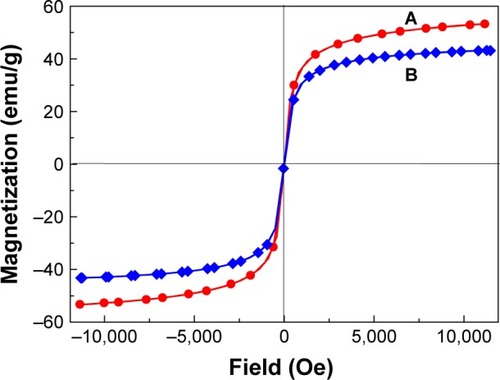
Figure 6 TEM micrographs of iron oxide magnetic nanoparticles (A), chitosan-iron oxide magnetic nanoparticles (B), and PTA-CS-MNP nanocomposite (C). Particle size distribution of iron oxide magnetic nanoparticles (D), chitosan-iron oxide magnetic nanoparticles (E), and PTA-CS-MNP nanocomposite (F).
Abbreviations: PTA-CS-MNP, phytic acid-chitosan-iron oxide nanocomposite; TEM, transmission electron microscopy.
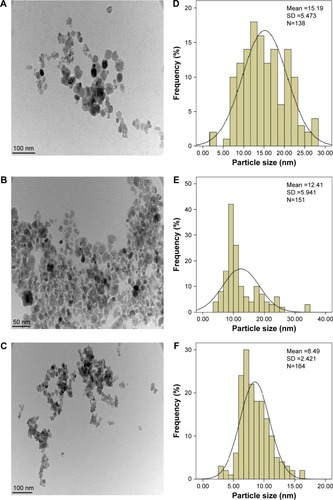
Figure 7 Release profiles of phytic acid from PTA-CS-MNP nanocomposite into phosphate-buffered saline solution at pH 7.4 and pH 4.8. The inset shows the release profiles of a physical mixture of phytic acid sodium salt with chitosan and iron oxide nanoparticles into phosphate-buffered saline solution at pH 7.4 and pH 4.8.
Abbreviation: PTA-CS-MNP, phytic acid-chitosan-iron oxide nanocomposite.
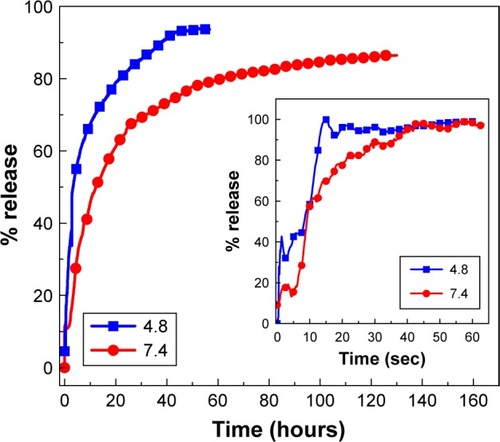
Table 1 Correlation coefficient (R2), rate constant (k), and half-life (t1/2) values obtained by fitting the release data of phytic acid from PTA-CS-MNP nanocomposite into phosphate-buffered saline solution at pH 4.8 and 7.4
Figure 8 Fitting of the data for phytic acid release from PTA-CS-MNP nanocomposite into various solutions to the pseudo-first order, pseudo-second order kinetics and parabolic diffusion model for pH 7.4 (A–C) and pH 4.8 (D–F).
Abbreviation: PTA-CS-MNP, phytic acid-chitosan-iron oxide nanocomposite.
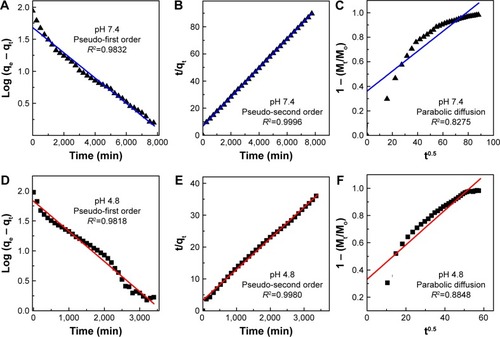
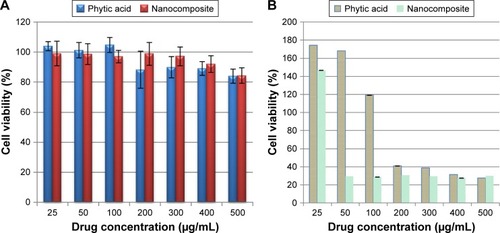
Figure 9 Cell viability (MTT assay) of 3T3 (A) and HT29 (B) cells exposed to various gradient concentrations. The data are presented as mean ± standard deviation of triplicate values.
Abbreviation: MTT, 3-(4,5-dimethylthiazol-2-yl)-2,5-diphenyltetrazolium bromide.