Figures & data
Figure 1 LDL–NSC–SS–UA micelles co-delivering BCRP siRNA and PTX for reversing MDR.
Abbreviations: BCRP, breast cancer resistance protein; GSH, glutathione; LDL, low-density lipoprotein; LDLr, LDL receptor; mRNA, messenger RNA; NSC–SS–UA, N-succinyl chitosan–cystamine–urocanic acid; PTX, paclitaxel; RISC, RNA-induced silencing complex; siRNA, small interfering RNA.
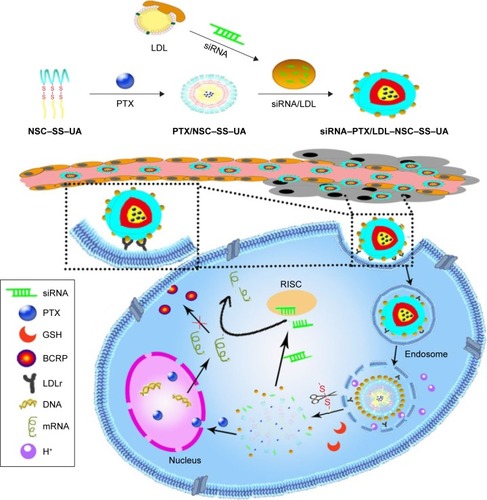
Figure 2 Synthesis and characterization of NSC–SS–UA.
Notes: (A) Synthesis of NSC–SS–UA. (B) FT-IR spectra of CS (a); NSC (b); NSC–SS (c); and NSC–SS–UA (d). (C) 1HNMR spectra of NSC (a); NSC–SS (b); and NSC–SS–UA (c). *Represents a monomer five-membered ring at the end of the long chain.
Abbreviations: CS, chitosan; EDC, 1-(3-Dimethylaminopropyl)-3-ethylcarbodiimide; FT-IR, Fourier transform infrared spectroscopy; NHS, N-hydroxysuccinimide; NSC, N-succinyl chitosan; NSC–SS, N-succinyl chitosan–cystamine; NSC–SS–UA, N-succinyl chitosan–cystamine–urocanic acid; ppm, parts per million.
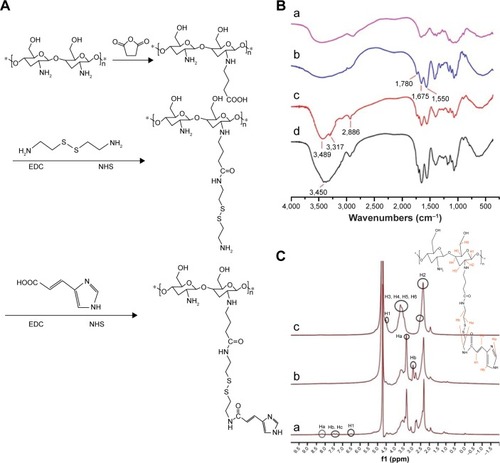
Figure 3 Evaluation of the siRNA/LDL complex and the siRNA–PTX/LDL–NSC–SS–UA micelles.
Notes: (A) RNase protection assay (a); Serum stability of chol-siRNA/LDL (n=3) (b). (B) FT-IR spectra of LDL (a); NSC–SS–UA (b); LDL–NSC–SS–UA (c); LDL and NSC–SS–UA mixture (d). (C) Size distribution and (D) TEM micrograph of siRNA–PTX/LDL–NSC–LA micelles (60,000× original magnification).
Abbreviations: Chol, cholesterol; siRNA, small interfering RNA; LDL, low-density lipoprotein; PTX, paclitaxel; NSC–SS–UA, N-succinyl chitosan–cystamine–urocanic acid; RNase, ribonuclease; FT-IR, Fourier transform infrared spectroscopy; TEM, transmission electron microscope; OD, optical density.
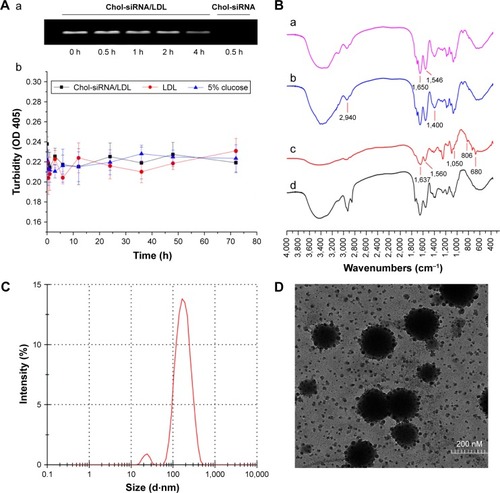
Figure 4 Evaluation of polymeric micelles.
Notes: (A) CMC of micelles. (B) Plot of I1/I3 and log C. (C) Particle size and zeta potential change of micelles. (D) In vitro release of PTX after incubation with PBS (pH 7.4) + GSH, PBS (pH 5.3), and PBS (pH 5.3) + GSH for 1 h.
Abbreviations: C, concentration; CMC, critical micelle concentration; GSH, glutathione; PBS, phosphate-buffered saline; PTX, paclitaxel.
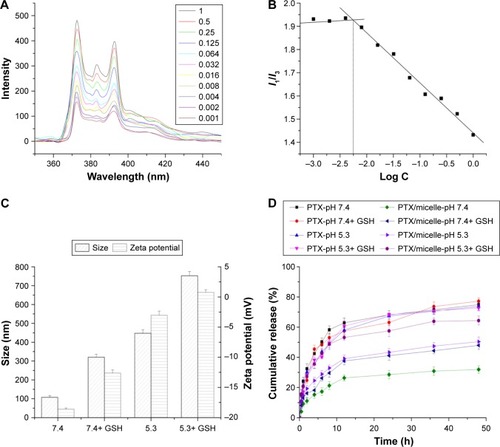
Figure 5 In vitro cytotoxicity of various micelles and disruption of subcellular structure.
Notes: (A) Cytotoxicity of two blank micelles against MCF-7 cells. (B) Cytotoxic effect of PTX in different formulations against MCF-7 cells. (C) Cytotoxicity of PTX/LDL–NSC–SS–UA at various PTX concentrations and durations of incubation. (D) Cytotoxicity of siRNA–PTX/LDL–NSC–SS–UA at various siRNA concentrations and durations of incubation. Data are represented as mean ± SD. (E) Observation of lysosomal disruption of MCF-7 cells treated with siRNA–PTX/LDL–NSC–SS–UA of different times using AO staining. Magnification 63×. (n=3, *P<0.05, **P<0.01, ***P<0.001).
Abbreviations: AO, acridine orange; LDL–NSC–SS–UA, low-density lipoprotein–N-succinyl chitosan–cystamine–urocanic acid; PTX, paclitaxel; siRNA, small interfering RNA; SD, standard deviation.
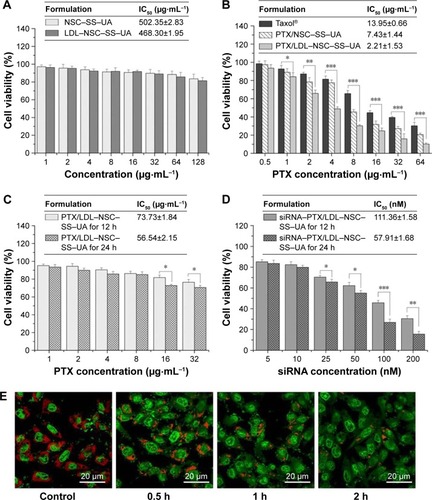
Figure 6 Cellular uptake and distribution of drug-loading micelles in vitro.
Notes: (A) Intracellular uptake and location of C6/NSC–SS–UA micelles (a) and C6/LDL–NSC–SS–UA micelles (b) in MCF-7 cells. (B) Dynamic uptake images of drug-loading micelles and the kinetics of C6 fluorescence intensities. (C) Quantitative uptake of PTX in different formulations in MCF-7 cells. Magnification 40×.
Abbreviations: FL1-H, fluorescence 1-height; LDL–NSC–SS–UA, low-density lipoprotein–N-succinyl chitosan–cystamine–urocanic acid; PTX, paclitaxel.
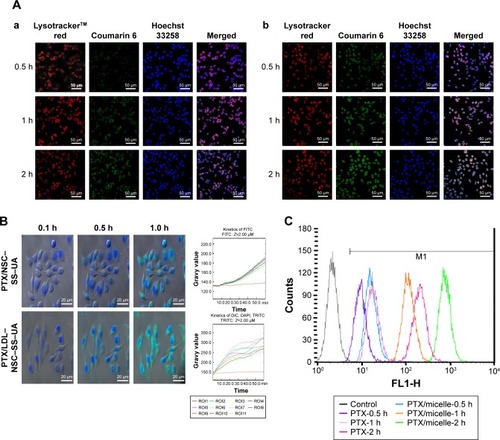
Figure 7 Cellular uptake and distribution of the siRNA–PTX/LDL–NSC–SS–UA micelles in MCF-7/Taxol cells in vitro.
Notes: (A) Intracellular uptake and location of siRNA–PTX/LDL–NSC–SS–UA micelles in MCF-7/Taxol cells. (B) Dynamic uptake images of micelles and kinetics of fluorescence intensity. (C) Quantitative uptake of micelles in MCF-7/Taxol cells with two-color flow cytometry. (D) Micelle uptake kinetic parameters obtained by the change in fluorescence over time. Magnification 40×.
Abbreviations: Cy3, cyanine 3; C6, coumarin 6; siRNA–PTX/LDL–NSC–SS–UA, small interfering RNA–paclitaxel/low-density lipoprotein–N-succinyl chitosan–cystamine–urocanic acid; DIC, differential interference contrast; FITC, fluorescein isothiocyanate; DAPI, 4′,6-diamidino-2-phenylindole.
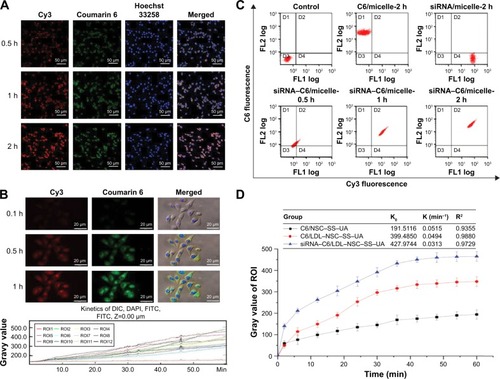
Figure 8 Semi-quantified analysis of the downregulation of BCRP expression.
Notes: RT-PCR (A) and Western blot (B) results after incubating the cells with chol-siRNA, PTX/LDL–NSC–SS–UA, and siRNA–PTX/LDL–NSC–SS–UA (2 µg·mL−1 PTX) for 24 or 48 h (n=3) (*P<0.05, **P<0.01, ***P<0.001).
Abbreviations: BCRP, breast cancer resistance protein; Chol, cholesterol; GAPDH, glyceraldehyde-3-phosphate dehydrogenase; PBS, phosphate-buffered saline; RT-PCR, reverse transcription-polymerase chain reaction; siRNA–PTX/LDL–NSC–SS–UA, small interfering RNA–paclitaxel/low-density lipoprotein–N-succinyl chitosan–cystamine–urocanic acid.
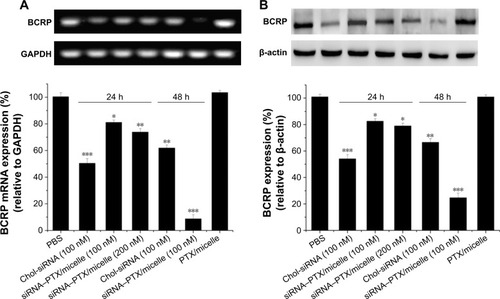
Figure 9 Targeting property and antitumor effect of micelles to MCF-7 tumors in vivo.
Notes: (A) NIR fluorescence real-time images of subcutaneously transplanted MCF-7 tumors treated with (a) Dir/NSC–SS–UA and (b) Dir/LDL–NSC–SS–UA. (B) Tumor volume and (C) relative body weight of mice after treatment with PTX in different formulations at different times. (D) Images and (E) weight of MCF-7 tumors stripped from mice (n=5) (**P<0.01, and ***P<0.005).
Abbreviations: Dir, 1,1′-dioctadecyl-3,3,3′,3′-tetramethylindotricarbocyanine; LDL–NSC–SS–UA, low-density lipoprotein–N-succinyl chitosan–cystamine–urocanic acid; NIR, near infrared spectroscopy; PTX, paclitaxel; siRNA, small interfering RNA.
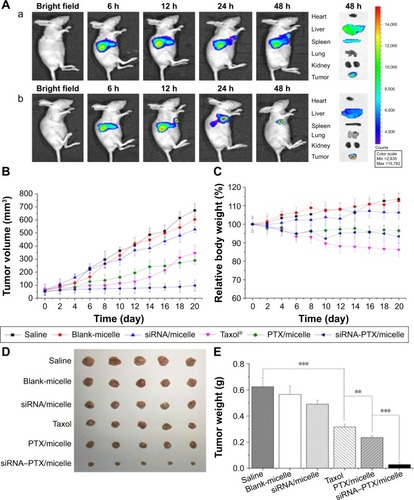
Figure S1 The size distribution of LDL.
Notes: The size distribution of LDL was measured by dynamic light scattering. The mean particle size and polydispersity index of LDL were 24.36±0.62 nm and 0.173, respectively.
Abbreviation: LDL, low-density lipoprotein.
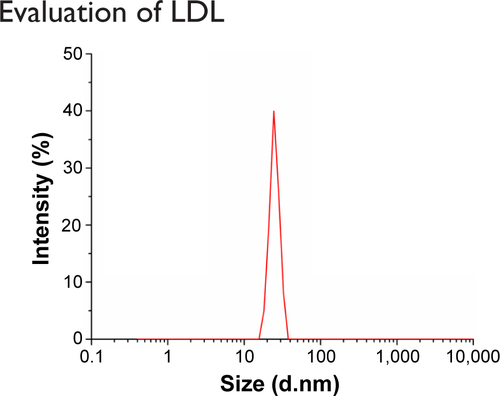
Figure S2 Hemolytic activity of Taxol and PTX-micelles.
Notes: The absorbance at 416 nm was tested after Taxol and PTX-micelles incubating with 2% RBC cells; n=3.
Abbreviations: PTX, paclitaxel; LDL–NSC–SS–UA, low-density lipoprotein–N-succinyl chitosan–cystamine–urocanic acid; RBC, red blood cell.
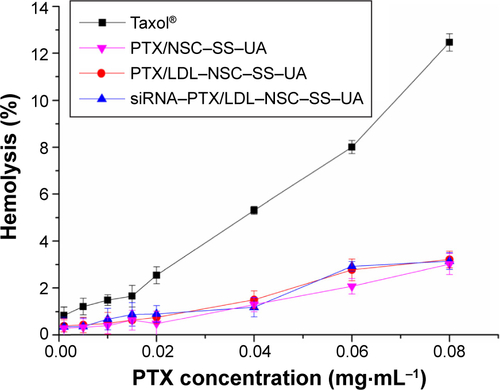
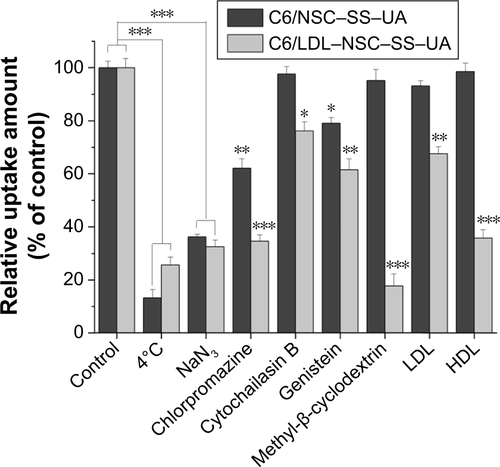
Figure S3 The endocytosis mechanism study of NSC–SS–UA and LDL–NSC–SS–UA micelles.
Notes: Relative fluorescent intensity of C6/micelles internalized by MCF-7 cells treated with PBS (control), LDL, HDL and different endocytosis inhibitors at 37°C, and PBS at 4°C using flow cytometry analysis. *P<0.05, **P<0.01, and ***P<0.005.
Abbreviations: HDL, high-density lipoprotein; LDL, low-density lipoprotein; NSC-SS-UA, N-succinyl chitosan–cystamine–urocanic acid; PBS, phosphate-buffered saline.