Figures & data
Table 1 Elemental composition of different samples measured by ICP-OES
Figure 1 SEM (top and middle rows) and TEM (bottom row) images: (A–C) MHMs, (D–F) Zn2-MHMs, (G–I) Zn5-MHMs. Inset in (H) shows the EDS element mapping for the distribution of Zn, Ca, P, and O in Zn5-MHMs.
Abbreviations: SEM, scanning electron microscopy; TEM, transmission electron microscopy; MHM, mesoporous hydroxyapatite microsphere; EDS, energy dispersive spectroscopy.
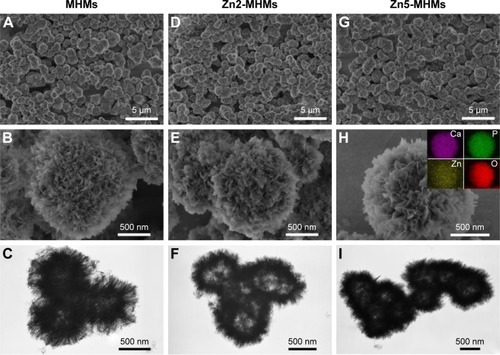
Figure 2 Physical characteristics of the MHMs, Zn2-MHMs, and Zn5-MHMs. (A) XRD patterns. (B) Nitrogen adsorption-desorption isotherms. (C) BJH pore size distributions.
Abbreviations: MHM, mesoporous hydroxyapatite microsphere; XRD, X-ray diffraction; BJH, Barrett-Joyner-Halenda; dV/dD, d(volume adsorbed)/d(diameter).
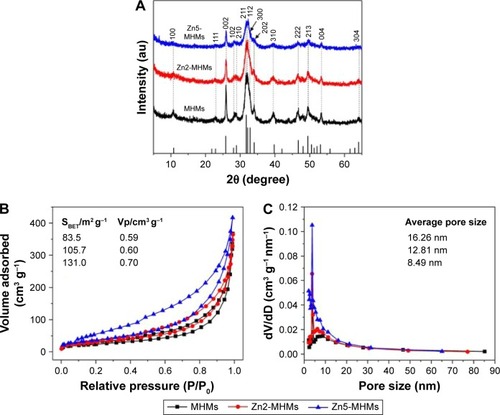
Figure 3 Drug release curves of (A) DOX-loaded MHMs and (B) DOX-loaded Zn5-MHMs in PBS solutions at different pH values. Cumulative release of DOX from (C) MHMs and (D) Zn5-MHMs as a function of the square root of the release time.
Abbreviations: DOX, doxorubicin hydrochloride; MHM, mesoporous hydroxyapatite microsphere; PBS, phosphate-buffered solution.
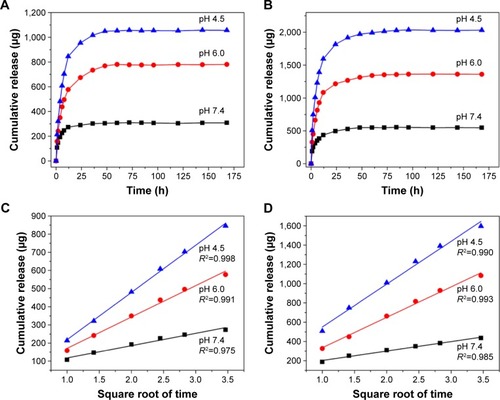
Figure 4 Physical characteristics of the Coll, MHMs/Coll, Zn2-MHMs/Coll, and Zn5-MHMs/Coll scaffolds. (A) SEM micrographs of the Coll (a–c), MHMs/Coll (d–f), Zn2-MHMs/Coll (g–i), and Zn5-MHMs/Coll scaffolds (j–l). (B) Release of Zn ions from the MHMs/Coll, Zn2-MHMs/Coll, and Zn5-MHMs/Coll scaffolds.
Abbreviations: MHMs/Coll, mesoporous hydroxyapatite microspheres/collagen scaffold; SEM, scanning electron microscopy.
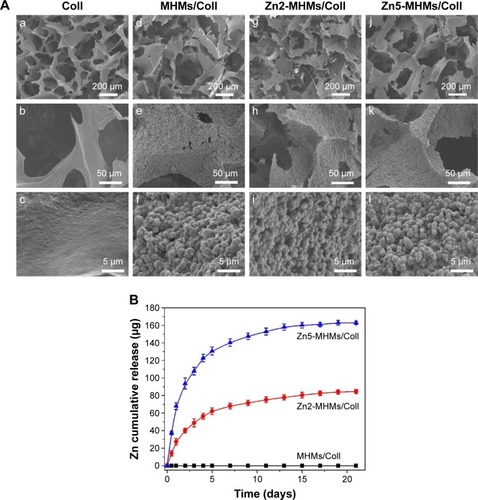
Figure 5 Cell morphology observation and viability assay on the Coll, MHMs/Coll, Zn2-MHMs/Coll, and Zn5-MHMs/Coll scaffolds. (A and B) CLSM and SEM images of rBMSCs on each type of scaffold after 7 days of culture. (C) Quantitative evaluation of the viability of rBMSCs on the four types of scaffolds at days 1, 3, and 7. *P<0.05 compared to Coll scaffolds.
Abbreviations: MHMs/Coll, mesoporous hydroxyapatite microspheres/collagen scaffold; CLSM, confocal laser scanning microscope; SEM, scanning electron microscopy; rBMSC, rat bone marrow–derived mesenchymal stem cell.
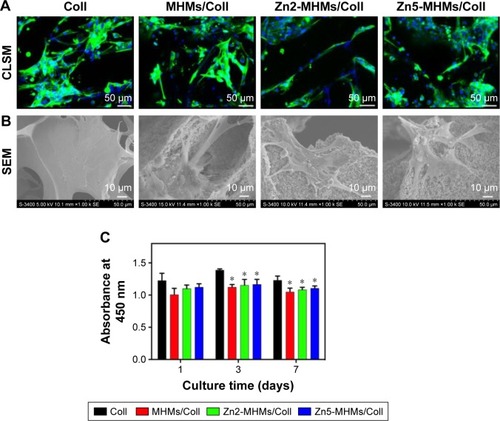
Figure 6 RT-qPCR analysis of the expression of osteogenesis-related genes (Runx2, Alp, and Ocn) in rBMSCs cultured on the Coll, MHMs/Coll, Zn2-MHMs/Coll, and Zn5-MHMs/Coll scaffolds for 7 and 14 days. *P<0.05 compared to Coll scaffolds; #P<0.05 compared to MHMs/Coll scaffolds; %P<0.05 compared to Zn2-MHMs/Coll scaffolds.
Abbreviations: RT-qPCR, real-time quantitative polymerase chain reaction; MHMs/Coll, mesoporous hydroxyapatite microspheres/collagen scaffold; rBMSC, rat bone marrow–derived mesenchymal stem cell.
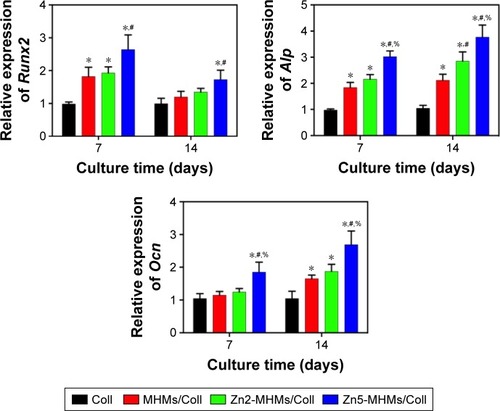
Figure 7 Micro-CT analysis of bone regeneration for the Coll, MHMs/Coll, and Zn5-MHMs/Coll groups at 8 weeks postimplantation. (A) 3D reconstructed superficial and interior images of femoral condyle defects implanted with different scaffolds. Morphometric analysis of the BV/TV (B), Tb.N (C), Tb.Sp (D), and Tb.Th (E) for each group. *P<0.05 compared to Coll group; #P<0.05 compared to MHMs/Coll group.
Abbreviations: micro-CT, micro-computed tomography; MHMs/Coll, mesoporous hydroxyapatite microspheres/collagen scaffold; 3D, three dimensional; BV/TV, bone volume to total volume ratio; Tb.N, trabecular number; Tb.Sp, trabecular spacing; Tb.Th, trabecular thickness.
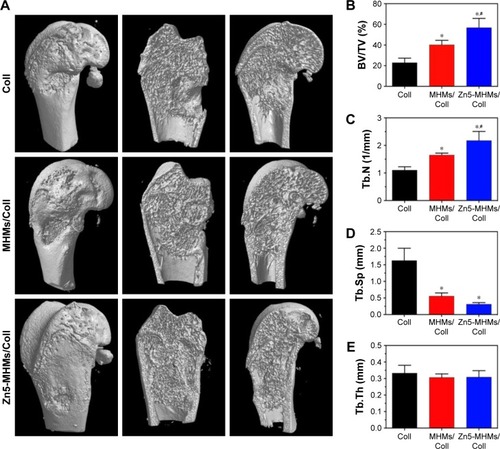
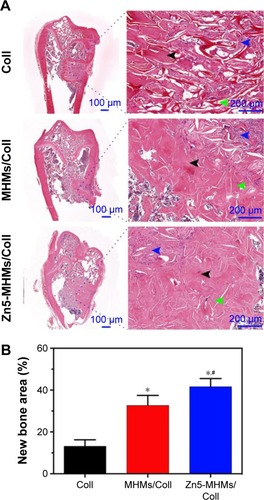
Figure 8 Histological evaluation of bone regeneration in each group. (A) HE staining for newly formed bone (black arrowhead), connective tissue (blue arrowhead), and scaffold remnants (green arrowhead). (B) The percentage of the new bone area assessed by histomorphometric analysis. *P<0.05 compared to Coll group; #P<0.05 compared to MHMs/Coll group.
Abbreviations: MHMs/Coll, mesoporous hydroxyapatite microspheres/collagen scaffold; HE, hematoxylin and eosin.