
Figures & data
Table 1 Primers used for real-time polymerase chain reaction
Figure 1 Surface characterization of the three types of samples.
Notes: (A) Surface morphologies of the three samples (Smooth, Micro and Nano) at different magnifications. (B, C) Surface roughness of prepared samples. (D) Surface wettability analyzed using water contact angles. ***P<0.001 versus Smooth surface; ###P<0.001 versus Micro surface.
Abbreviations: Ra, average roughness; Rz, average maximum height.
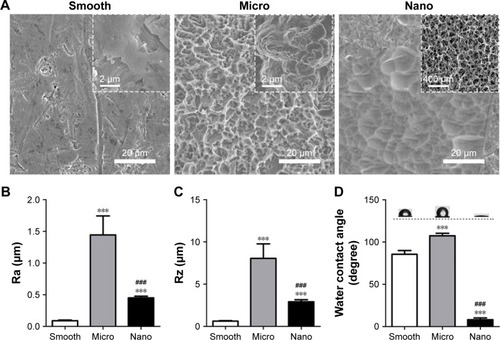
Figure 2 Behavior of human MG-63 osteoblasts on three types of surfaces.
Notes: (A) Cell morphology after 24 hours of seeding. (B, C) Cell proliferation measured with the WST-8 kit and 4′,6-diamidino-2-phenylindole staining after 1, 3 and 5 days of culture. (D) Osteogenic gene expression (ALP, COL 1 and OCN) measured with quantitative real-time polymerase chain reaction after 7 and 14 days of incubation. (E) ALP activity after culturing for 14 days. (F) Protein expression of OCN detected using immunofluorescence staining after 14 days of culture; OCN (red), actin (green) and nucleus (blue). ***P<0.001 versus Smooth surface.
Abbreviations: ALP, alkaline phosphatase; COL 1, type I collagen; OCN, osteocalcin; OD, optical density.
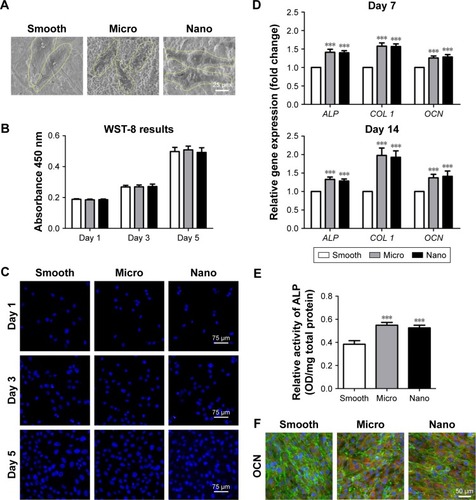
Figure 3 Behavior of human gingival epithelial cells on three types of surfaces.
Notes: (A) Cell morphology after 24 hours of seeding. (B) Adhesion-related gene expression (laminin α3, laminin β3, laminin γ2, integrin α6 and integrin β4) measured with quantitative real-time polymerase chain reaction after 24 hours of incubation. (C) Protein expression of integrin β4 detected using immunofluorescence staining after 24 hours of culture; integrin β4 (red), actin (green) and nucleus (blue). (D, E) Cell proliferation measured with the WST-8 kit and 4′,6-diamidino-2-phenylindole staining after 1, 3 and 5 days of culture. *P<0.05, **P<0.01, ***P<0.001 versus Smooth surface; ###P<0.001 versus Micro surface.
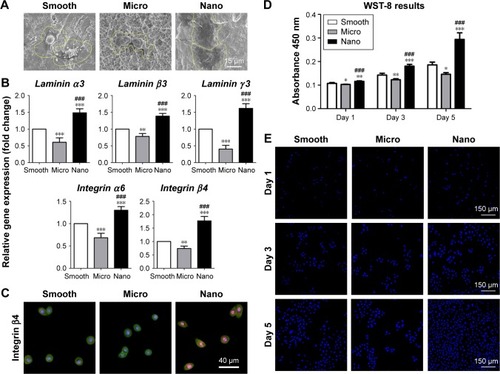
Figure 4 Behavior of human gingival fibroblasts on three types of surfaces.
Notes: (A) Cell morphology after 24 hours of seeding. (B) Adhesion-related gene expression (fibronectin, integrin α3, integrin β1 and vinculin) measured with quantitative real-time polymerase chain reaction after 24 hours of incubation. (C) Protein expression of vinculin is detected using immunofluorescence staining after 24 hours of culture; vinculin (red), actin (green) and nucleus (blue). (D, E) Cell proliferation measured with the WST-8 kit and DAPI staining after 1, 3 and 5 days of culture. ***P<0.001 versus Smooth surface.
Abbreviation: DAPI, 4′,6-diamidino-2-phenylindole.
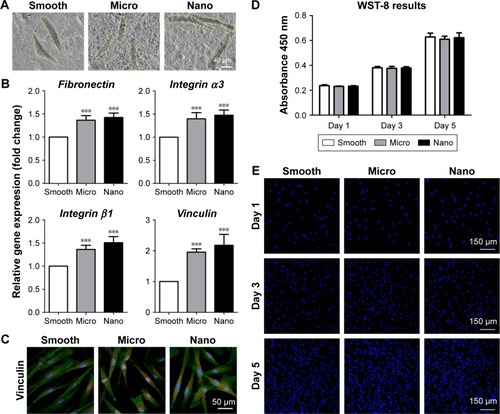
Figure 5 Behavior of THP-1 macrophage polarization on three types of surfaces.
Notes: THP-1 cells were exposed to PMA (100 ng/mL) overnight for M0 differentiation and then were cultured in fresh medium alone (M0 control) or fresh medium containing IFN-γ plus LPS (M1) or IL-4 (M2) for another 24 hours. (A) Cell morphology of M0, M1 and M2. (B) Gene expression of CCR7 (M1 marker) and CD206 (M2 marker) measured with quantitative real-time polymerase chain reaction after treatment with control, IFN-γ plus LPS or IL-4. (C) Protein expression of CCR7 (M1 marker) and CD206 (M2 marker) was measured using immunofluorescence staining after treatment with control, IFN-γ plus LPS or IL-4; CCR7 and CD206 (red), actin (green) and nucleus (blue).
Abbreviations: CCR7, C–C chemokine receptor type 7; CD206, cluster of differentiation 206; IFN-γ, interferon gamma; IL-4, interleukin-4; LPS, lipopolysaccharide; PMA, phorbol 12-myristate 13-acetate.
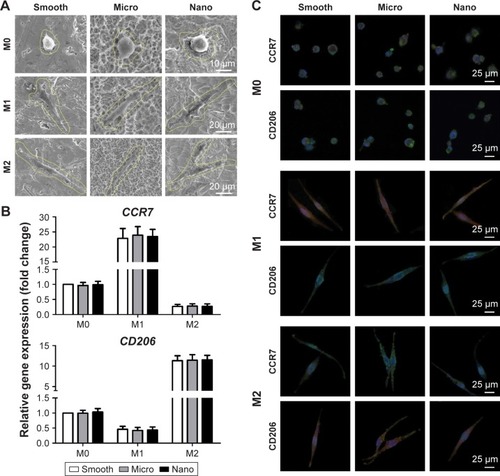
Figure 6 Behavior of Streptococcus mutans on three types of surfaces.
Notes: (A, B) Bacterial adhesion after 1 hour of culture as analyzed using the bacteria counting method (CFU/cm2) and SEM. (C, D) Biofilm formation after 24 hours of incubation as analyzed using the bacteria counting method (CFU/cm2) and SEM. **P<0.01, ***P<0.001 versus Smooth surface; ###P<0.001 versus Micro surface.
Abbreviations: CFU, colony forming units; SEM, scanning electron microscope.
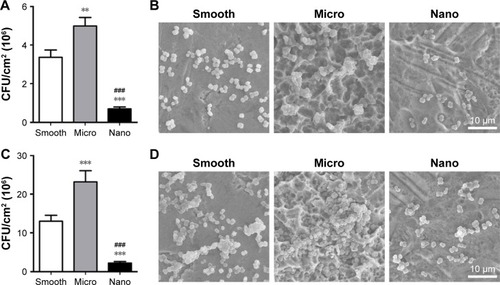
Figure S1 X-ray photoelectron spectroscopy pattern of the three types of specimens.
Abbreviation: au, arbitrary unit.
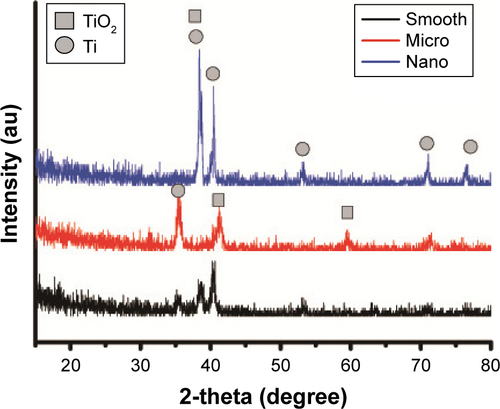
Figure S2 Protein expression of osteocalcin detected using immunofluorescence staining after 14 days of culture; osteocalcin (red), actin (green) and nucleus (blue).
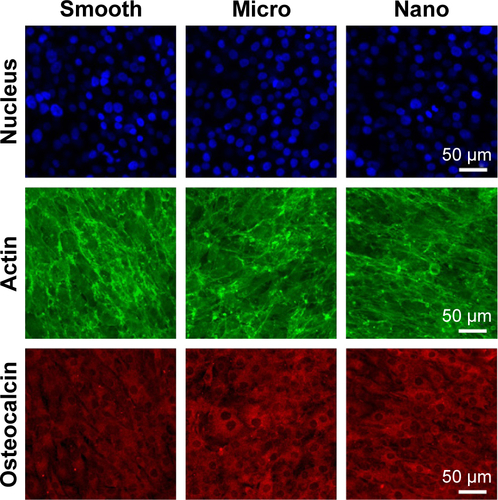
Figure S3 Protein expression of integrin β4 detected using immunofluorescence staining after 24 hours of culture; integrin β4 (red), actin (green) and nucleus (blue).
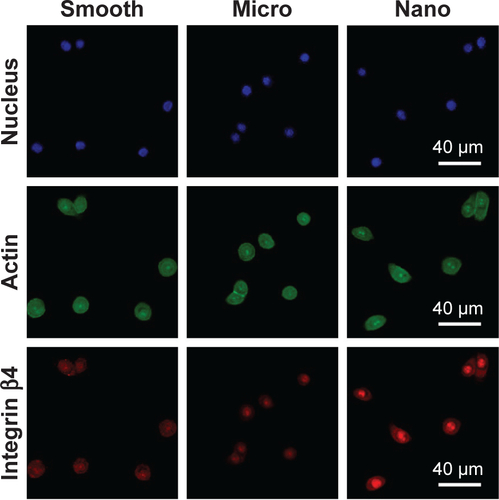
Figure S4 Protein expression of vinculin detected using immunofluorescence staining after 24 hours of culture; vinculin (red), actin (green) and nucleus (blue).
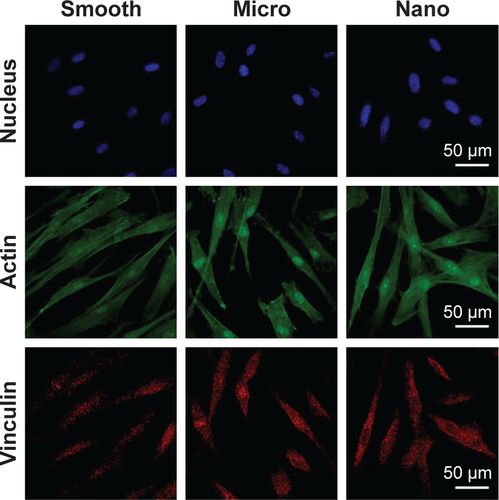
Figure S5 Protein expression of CCR7 (M1 marker) and CD206 (M2 marker) was measured using immunofluorescence staining after treatment with control, interferon gamma plus lipopolysaccharide or interleukin-4; CCR7 and CD206 (red).
Abbreviations: CCR7, C–C chemokine receptor type 7; CD206, cluster of differentiation 206.
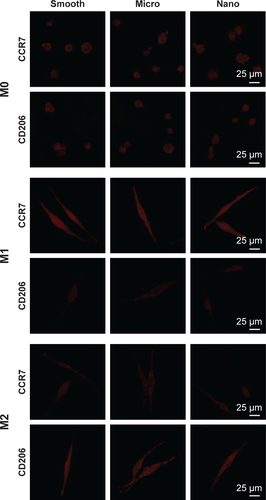
Table S1 Percent contents of C, O and Ti elements for various samples determined by X-ray photoelectron spectroscopy