Figures & data
Figure 1 Representative histological lung sections obtained 24 hours after intratracheal instillation of either saline or 0.1 or 0.5 mg/kg cerium oxide nanoparticles (CeO2 NPs) in mice. (A–D) Are representative sections of control lungs. (A–D) Show normal lung tissue with unremarkable changes. (E–H) Are representative sections of lungs exposed to 0.1 mg/kg CeO2 NPs. (E) Shows the presence of CeO2 NPs within alveolar macrophages (thin arrows). (F) Shows the presence CeO2 NPs within alveolar space (thin arrow) and within the alveolar interstitial space (arrow head) associated with focal damage to the alveolar wall. (G) Shows the expansion of the alveolar interstitial space with neutrophil polymorphs (arrow head) and macrophages (thick arrow). CeO2 NPs are seen within alveolar macrophages (thin arrow). (H) Shows the expansion of the alveolar interstitial space with neutrophil polymorphs (thin arrow) and macrophages (thick arrow). (I–L) Are representative sections of lungs exposed to 0.5 mg/kg CeO2 NPs. (I) Shows severe expansion of the alveolar interstitial space with neutrophil polymorphs (thin arrow). (J) Shows severe expansion of the alveolar interstitial space with neutrophil polymorphs (arrow head) and macrophages (thin arrow). (K) Shows severe expansion of the alveolar interstitial space with neutrophil polymorphs (arrow head) and macrophages (thick arrow). CeO2 NPs are seen within a macrophage (thin arrow). (L) CeO2 NPs are seen within an alveolar macrophage (thin arrow). The scale bar on images A–C, I, and J is 200 μm. The scale bar on images D–H, and K is 50 μm.
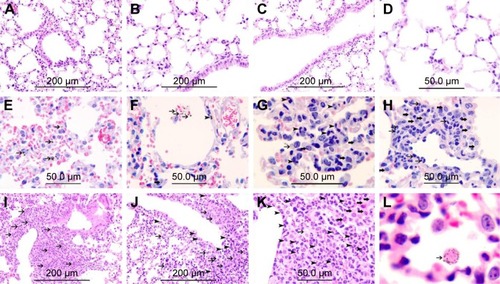
Figure 2 Total numbers of cells (A) and neutrophil numbers (B) in bronchoalveolar lavage (BAL) fluid 24 hours after intratracheal instillation of either saline or 0.1 or 0.5 mg/kg cerium oxide nanoparticles (CeO2 NPs) in mice. Data are mean ± standard error of the mean (n=6–8 in each group).
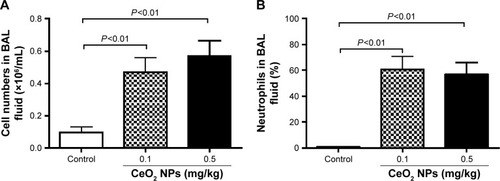
Figure 3 Tumor necrosis factor-α concentration (TNFα) (A) and catalase activity (B) in bronchoalveolar lavage (BAL) fluid, 24 hours after intratracheal instillation of either saline or 0.1 or 0.5 mg/kg cerium oxide nanoparticles (CeO2 NPs) in mice. Data are mean ± standard error of the mean (n=6–8 in each group).
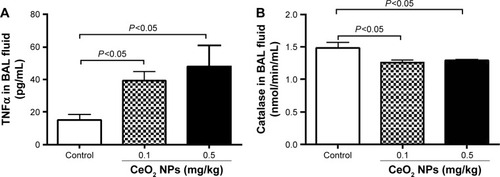
Figure 4 C-reactive protein (CRP) (A) and tumor necrosis factor-α (TNFα) (B) concentrations, and catalase (C) and total antioxidant (D) activities in plasma 24 hours after intratracheal instillation of either saline or 0.1 or 0.5 mg/kg cerium oxide nanoparticles (CeO2 NPs) in mice. Data are mean ± standard error of the mean (n=6–8 in each group).
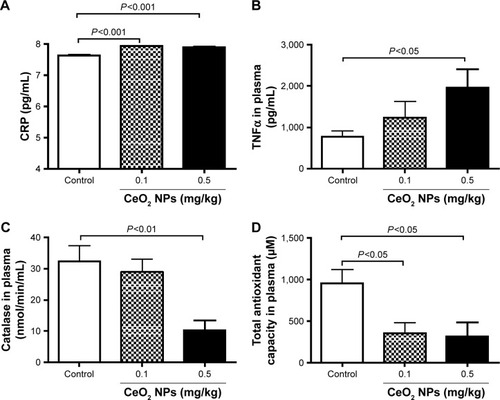
Figure 5 Thrombotic occlusion time in pial arterioles (A) and venules (B) 24 hours after intratracheal instillation of either saline or 0.1 or 0.5 mg/kg cerium oxide nanoparticles (CeO2 NPs) in mice. Data are mean ± standard error of the mean (n=6–8 in each group).
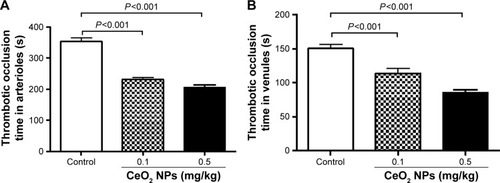
Figure 6 Fibrinogen (A) and plasminogen activator inhibitor-1 (PAI-1) (B) concentrations in plasma 24 hours after intratracheal instillation of either saline or 0.1 or 0.5 mg/kg cerium oxide nanoparticles (CeO2 NPs) in mice. Data are mean ± standard error of the mean (n=6–8 in each group).
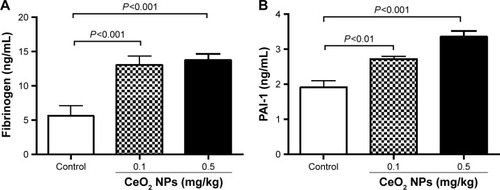
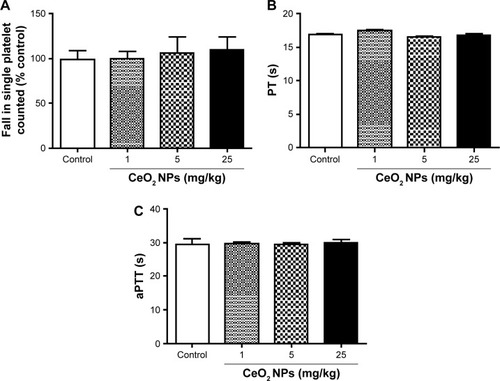
Figure 7 In vitro platelet aggregation in whole blood (A), prothrombin time (PT) (B), and activated partial thromboplastin time (aPTT) (C) after incubation with either saline or cerium oxide nanoparticles (CeO2 NPs, 1, 5, or 25 μg/mL). Data are mean ± standard error of the mean (n=4–6 in each group).