Figures & data
Table 1 Size measured by DLS, expressed as z-average and PDI
Figure 1 UV/Vis spectra of gH625-QDs and QDs alone.
Abbreviations: QDs, quantum dots; UV/Vis, ultraviolet/visible.
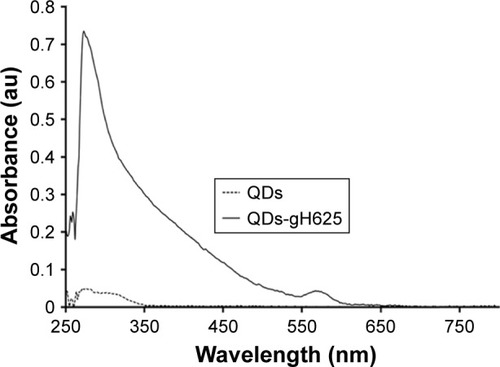
Table 2 Mean effective concentration from toxicity tests (95% CI shown in brackets) against exposure to QDs and gH625-QDs for 48 h
Figure 2 Immobility of Daphnia magna exposed to QDs and gH625-QDs for 48 h; dashed line represents confidence intervals.
Notes: The concentrations reported are relative to QDs (the concentration of 10 nM QDs corresponds to a peptide concentration of 43 µM). Data are reported as mean ± SEM (n=9). Bonferroni post hoc test following two-way ANOVA versus the QDs group. All the data present significant differences (P<0.001).
Abbreviations: ANOVA, analysis of variance; QDs, quantum dots; SEM, standard error of the mean.
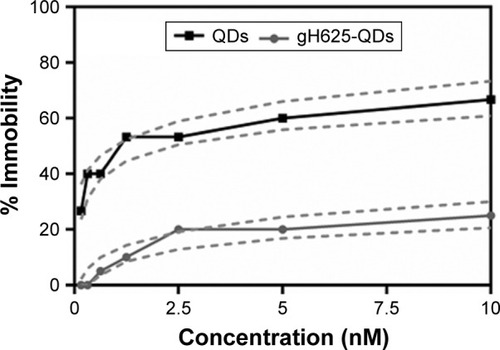
Figure 3 Comet assay. Histogram of DNA damage of Daphnia magna added to QD, with or without gH625. Results are expressed as mean ± SD (P<0.05).
Abbreviations: QD, quantum dot; SD, standard deviation; Ctl, control.
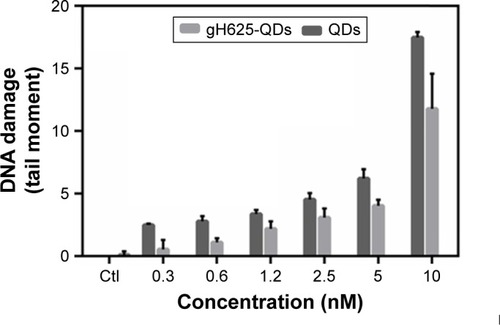
Figure 4 Observed heart rate of Daphnia magna after exposure to QDs and QDs-gH625. The results are relative to average of beats ± SD.
Abbreviations: bpm, beats per min; QD, quantum dot; SD, standard deviation; Ctl, control.
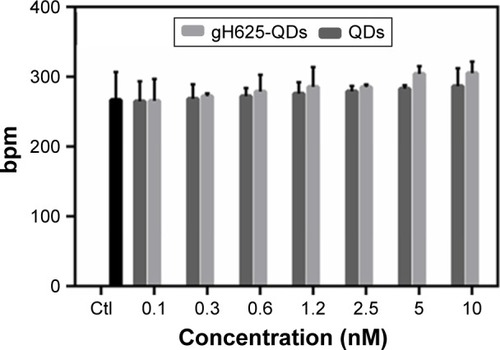
Figure 5 Fluorescence image of Daphnia magna after exposure (30′, 60′, 90′, 6 h and 24 h) to QDs and QDs-gH625 (5 nM).
Abbreviations: QD, quantum dot; Ctl, control.
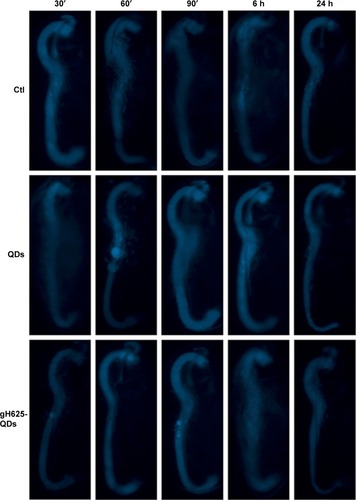
Figure 6 Response of Daphnia magna to oxidative stress on exposure to QDs and gH625-QDs for 24 h.
Notes: (A) ROS production by dichlorofluorescein fluorescence. Data are given as fluorescence values (mean ± SEM [n=9]). *P<0.05, **P<0.01 and ***P<0.001, Tukey post hoc test following one-way ANOVA versus the control group (Ctl). (B) CAT activity is expressed as units* mg−1 of protein mean ± SEMs (n=9). *P<0.05, **P<0.01 and ***P<0.001, Bonferroni post hoc test following two-way ANOVA versus the QDs group. (C) SOD activity is given as percentage of SOD inhibition compared to the control mean ± SEMs (n=9). *P<0.05, **P<0.01 and ***P<0.001, Bonferroni post hoc test following two-way ANOVA versus the QDs group. All the data show significant differences (P<0.05) compared to the control group (Ctl).
Abbreviations: ANOVA, analysis of variance; CAT, catalase; QD, quantum dot; ROS, reactive oxygen species; SD, standard deviation; SEM, standard error of the mean; SOD, superoxide dismutase.
![Figure 6 Response of Daphnia magna to oxidative stress on exposure to QDs and gH625-QDs for 24 h.Notes: (A) ROS production by dichlorofluorescein fluorescence. Data are given as fluorescence values (mean ± SEM [n=9]). *P<0.05, **P<0.01 and ***P<0.001, Tukey post hoc test following one-way ANOVA versus the control group (Ctl). (B) CAT activity is expressed as units* mg−1 of protein mean ± SEMs (n=9). *P<0.05, **P<0.01 and ***P<0.001, Bonferroni post hoc test following two-way ANOVA versus the QDs group. (C) SOD activity is given as percentage of SOD inhibition compared to the control mean ± SEMs (n=9). *P<0.05, **P<0.01 and ***P<0.001, Bonferroni post hoc test following two-way ANOVA versus the QDs group. All the data show significant differences (P<0.05) compared to the control group (Ctl).Abbreviations: ANOVA, analysis of variance; CAT, catalase; QD, quantum dot; ROS, reactive oxygen species; SD, standard deviation; SEM, standard error of the mean; SOD, superoxide dismutase.](/cms/asset/2f0bb977-adba-4e12-ac6e-95c06cc2b787/dijn_a_127226_f0006_b.jpg)
Table 3 Embryotoxic effects in Xenopus laevis
Figure 7 Embryotoxic parameters in Xenopus laevis.
Notes: (A) Mortality evaluation. The mortality distributions were evaluated by nonparametric Mantel–Cox test, which gave P>0.05. (B) Growth retardation analysis. The growth retardation was evaluated with ANOVA statistical test, which gave P>0.05. (C) Observed heart rate of Xenopus laevis after exposure to QDs and QDs-gH625. The heartbeat was evaluated with ANOVA statistical test, which gave P>0.05. (D) Analysis of dorsal pigmentation. The dorsal pigmentation was evaluated with ANOVA statistical test, which gave P>0.05. Data are reported as mean ± SD.
Abbreviations: ANOVA, analysis of variance; QDs, quantum dots; SD, standard deviation; Ctl, control.
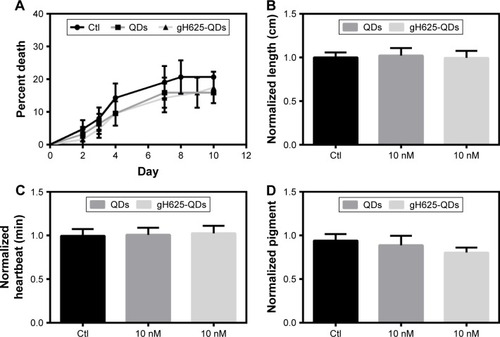
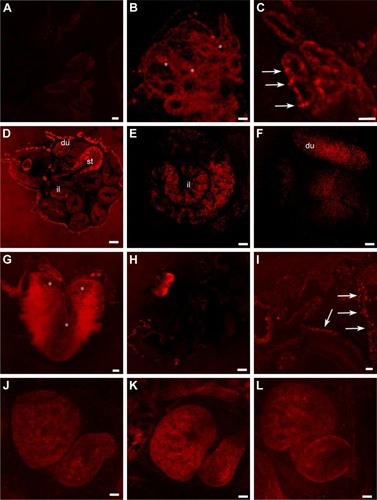
Figure 8 gH625-QDs confocal localization in stage 46 Xenopus laevis embryos.
Notes: (A) Control section. (B, C) Optical sections of primordium of lung treated with (B) naked QDs and (C) gH625-QDs. QDs localize in the form of widespread dots (B, asterisks) in contrast gH625-QDs, which are disposed in small fluorescent areas (C, arrows). In the intestine (D–F), gH625-QDs are visible only in some stretches: st, du and il. Hindbrain shows a slight localization of gH625-QDs (G, asterisks). (H) QDs are barely visible in the gills (I) gH625-QDs have a distribution similar to the gills (arrows). (J–L) QDs and gH626-QDs are not visible in the heart. Bars: (A–C, G, I) =20 µm; (E, F, K, J, L) =50 µm; (H) =100 µm; (D) =200 µm.
Abbreviations: du, duodenum; il, ileum; QDs, quantum dots; st, stomach.