
Figures & data
Figure 1 AgNPs characterization.
Notes: (A) Plasmon band position of AgNPs by UV–vis absorption spectroscopy and AgNPs colloidal solution (inset); (B) TEM image of AgNPs suspended in water, scale bar: 100 nm. AgNPs size distribution evaluated by (C) DLS in 1 mM citrate and (D) DCS in a sucrose gradient.
Abbreviations: AgNPs, silver nanoparticles; DCS, differential centrifugal sedimentation; DLS, dynamic light scattering; TEM, transmission electron microscopy; UV–vis, ultraviolet–visible.
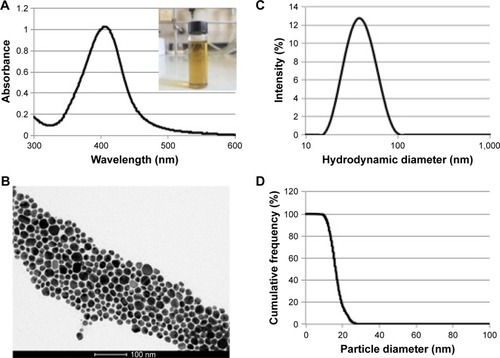
Table 1 Nanoparticles characterization
Figure 2 Antibacterial activity of AgNPs (0.54 ng/mLsilver content) in E. coli MG1665 after 2 h. Samples show statistical differences from AgNPs samples at ***P<0.0005; **P<0.01; *P<0.05.
Abbreviations: AgNO3, silver nitrate; AgNPs, silver nanoparticles; CSNPs, colloidal silver nanoparticles; E. coli, Escherichia coli; SNPs, silver nanoparticles.
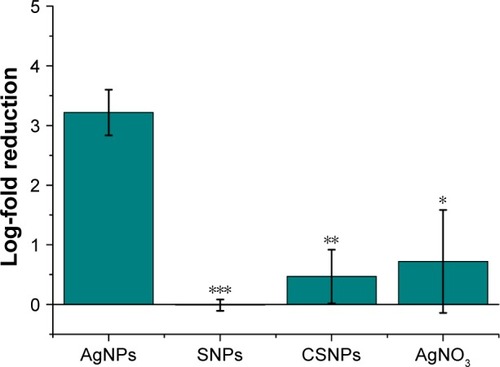
Figure 3 Antibacterial activity of AgNPs (5.4 ng/mL silver content) in S. aureus after 2 h. Samples show statistical differences from AgNPs samples at ***P<0.0005; +P<0.2.
Abbreviations: AgNO3, silver nitrate; AgNPs, silver nanoparticles; CSNPs, colloidal silver nanoparticles; S. aureus, Staphylococcus aureus; SNPs, silver nanoparticles.
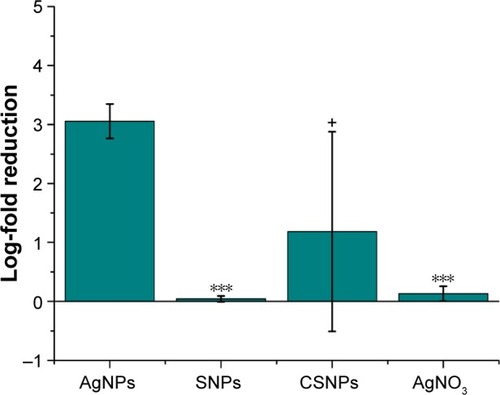
Figure 4 Long-term antibacterial activity of nanoparticles.
Note: AgNPs and CSNPs (0.054 ng/mL silver content) were incubated with E. coli MG1665 for 2, 4, 6, and 24 h.
Abbreviations: AgNPs, silver nanoparticles; CSNPs, colloidal silver nanoparticles; E. coli, Escherichia coli.
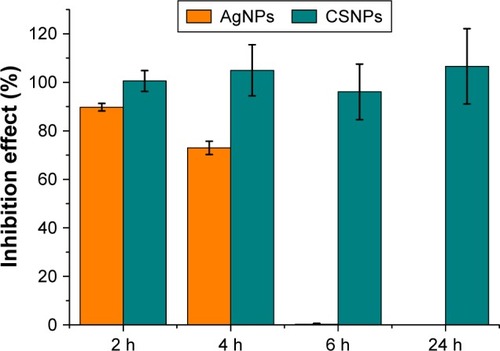
Figure 5 Antibacterial activity of AgNPs after the phase transfer, suspended in THF in
Escherichia coli MG1665 (0.54 ng/mL silver content) and in Staphylococcus aureus (5.4 ng/mL silver content) after 2 h.
Abbreviations: AgNPs, silver nanoparticles; THF, tetrahydrofuran.
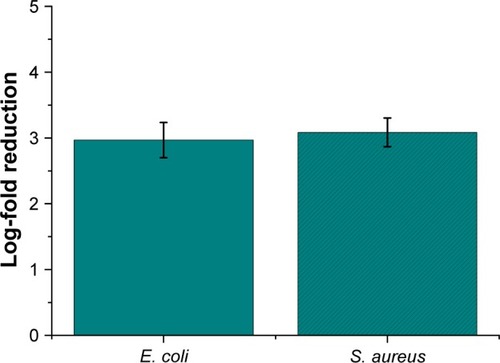
Figure 6 MTT assay performed incubating water-suspended AgNPs (10 and 1 ng/mL silver content) with murine fibroblasts 3T3-L1.
Abbreviations: AgNPs, silver nanoparticles; MTT, 3-(4,5-dimethyl-2-thiazolyl)-2,5-diphenyl-2H-tetrazolium bromide.
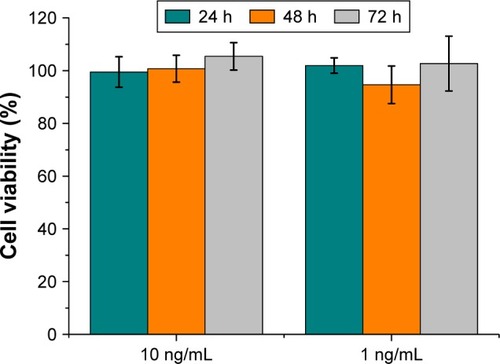
Figure 7 MTT assay performed incubating AgNPs suspended in THF (10 and 1 ng/mL silver content) with murine fibroblasts 3T3-L1.
Abbreviations: AgNPs, silver nanoparticles; MTT, 3-(4,5-dimethyl-2-thiazolyl)-2,5-diphenyl-2H-tetrazolium bromide; THF, tetrahydrofuran.
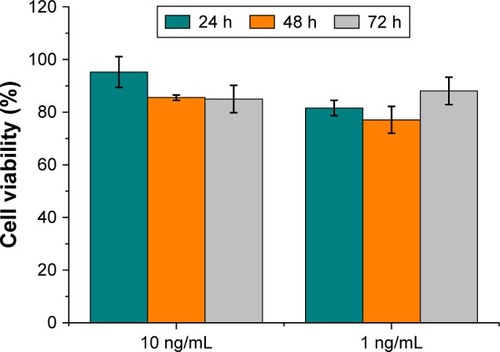
Figure 8 External morphology of untreated (A, C) and treated (B, D) Escherichia coli cells visualized with SEM (A, B) and TEM (C, D), respectively. Arrows indicate corrugations; * indicate membrane swelling (scale bars of panels A, B =3 µm; panel C =500 nm; panel D =1 µm).
Abbreviations: SEM, scanning electron microscopy; TEM, transmission electron microscopy.
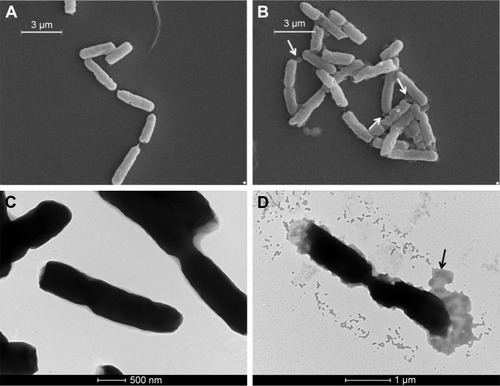
Figure 9 External morphology of untreated (A, C) and treated Staphylococcus aureus cells (B, D) visualized with SEM (A, B) and TEM (C, D), respectively. Big arrows indicate electron-dense AgNPs, whereas small arrows indicate swelling (scale bars of panels A, B =3 µm; panel C =2 µm; panel D =500 nm).
Abbreviations: AgNPs, silver nanoparticles; SEM, scanning electron microscopy; TEM, transmission electron microscopy.
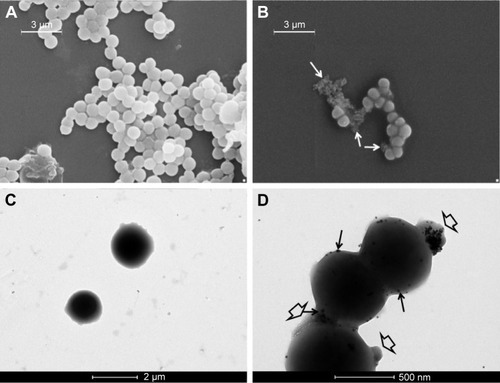
Figure 10 TEM images of untreated (A) and treated (B, C) Staphylococcus aureus cells from the pellet. In panel B, there is a cell that presents a mesosome-like particle (M). In panel C, a lysed cell is represented (scale bars of panel A =500 nm; panels B, C =200 nm).
Abbreviation: TEM, transmission electron microscopy.
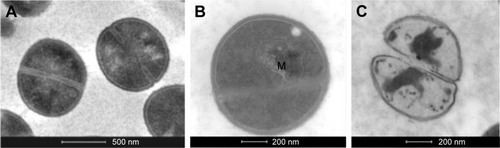
Figure S1 Plasmon band position of three samples of AgNPs by UV–vis absorption spectroscopy.
Abbreviations: AgNPs, silver nanoparticles; UV–vis, ultraviolet–visible.
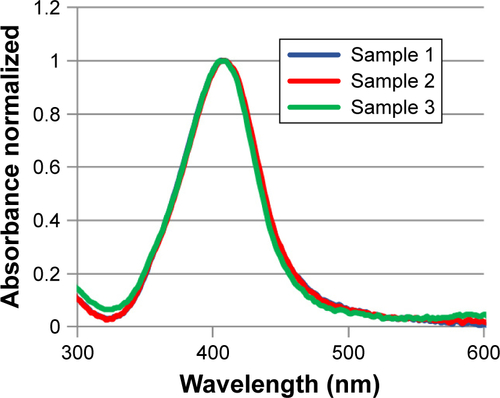
Figure S2 TEM images of AgNPs suspended in water, scale bar: 50 nm (left) and 100 nm (right).
Abbreviations: AgNPs, silver nanoparticles; TEM, transmission electron microscopy.
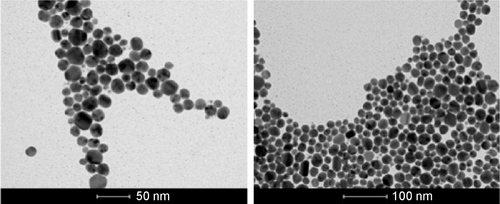
Figure S3 Long-term stability of AgNPs in citrate buffer 1 mM and phosphate buffer 0.3 mM (pH 7.2) (A) expressed as absorbance at λmax variations as function of time; plasmon band position of AgNPs by UV–vis absorption spectroscopy (B).
Abbreviations: AgNPs, silver nanoparticles; UV–vis, ultraviolet–visible.
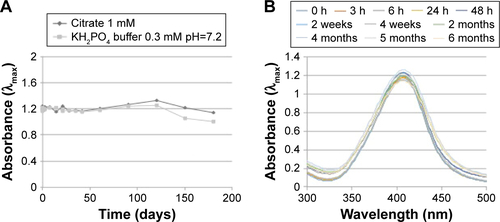
Figure S4 AgNPs stability evaluated by UV–vis spectroscopy in citrate 1 mM before (red line) and after (blue line) the lyophilization (left). TEM image of lyophilized AgNPs (right).
Abbreviations: AgNPs, silver nanoparticles; TEM, transmission electron microscopy; UV–vis, ultraviolet–visible.
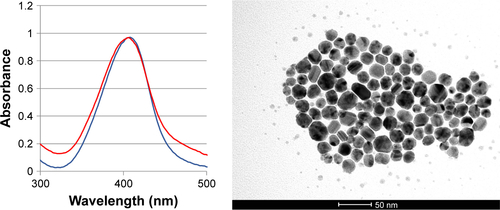
Figure S5 AgNPs suspended in bacteria nutrient broth (orange line) and in sodium citrate 1 mM solution (blue line). In the first case, as broader peak shows, nanoparticles aggregation occurs.
Abbreviation: AgNPs, silver nanoparticles.
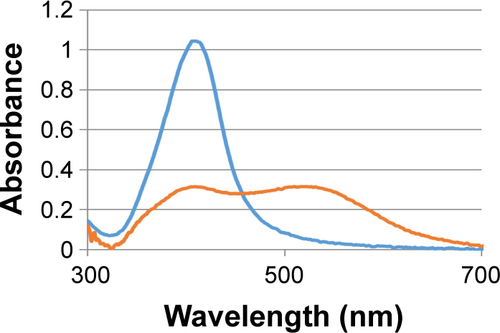
Figure S6 TEM images of CSNPs, scale bar: 50 nm (left) and SNPs scale bar: 100 nm (right).
Abbreviations: CSNPs, colloidal silver nanoparticles; SNPs, silver nanoparticles; TEM, transmission electron microscopy.
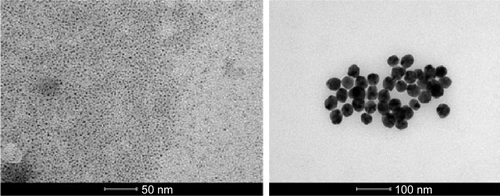
Figure S7 AgNPs in toluene characterization.
Notes: (A) AgNPs phase transfer in toluene; (B) TEM image of AgNPs in toluene; (C) AgNPs stability in water (blue line) after the phase transfer in toluene (red line). Differences of UV–vis spectra may be due to surface binding of octadecylamine and increasing in the refractive index from water (refractive index, n=1.33) to toluene (n=1.50).
Abbreviations: AgNPs, silver nanoparticles; TEM, transmission electron microscopy; UV–vis, ultraviolet–visible.
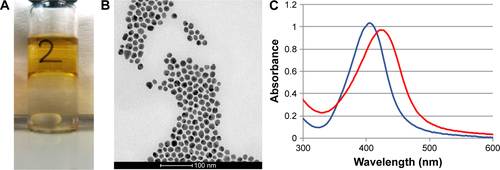
Table S1 Silver nanoparticles characterization