Figures & data
Table 1 Influence of serum on hydrodynamic size of SNPs
Figure 1 Transmission electron microscopy images of silica nanoparticles in serum-free Dulbecco’s Modified Eagle’s Medium (×100,000).
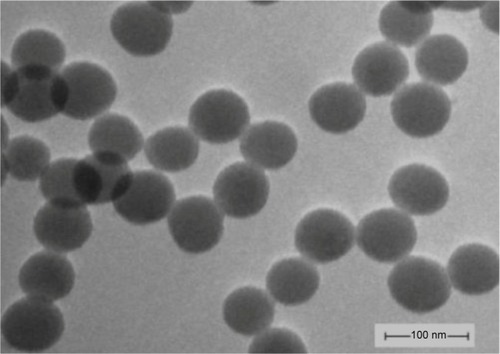
Figure 2 Viability of H9c2 cells after exposure to silica nanoparticles at different concentrations and times. The results indicated that viability of H9c2 cells reduced in both concentration- and time-dependent manner (mean, n=6).
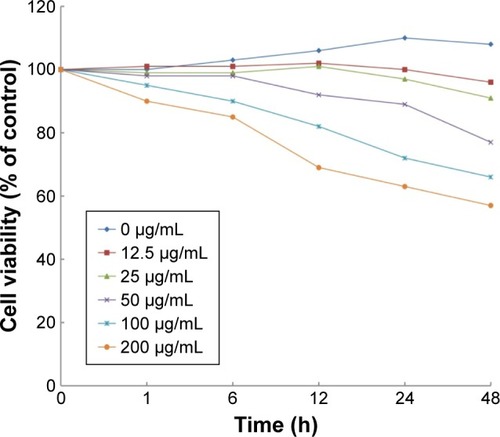
Figure 3 Silica nanoparticles (SNPs)-induced gap junction intercellular communication (GJIC) inhibition in H9c2 cells. (A) SNPs-induced downregulation of GJIC in H9c2 cells. Lucifer yellow (LY, green) transferred to adjacent cells via open gap junctions. (B) The average distance of LY spread from the side of the scraped edge from six different sites in each sample was obtained and quantified. (C and D) Reduced expression of connexin 43 (Cx43) and P-Cx43 after SNPs treatment was detected using Western blot. Values represent the mean ± standard deviation (n=6). aP<0.05, vs control group; bP<0.05, vs 25 μg/mL group; cP<0.05, vs 50 μg/mL group.
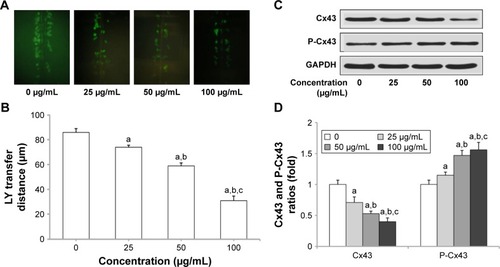
Figure 4 Effect of gap junction activator retinoic acid (RA) and inhibitor carbenoxolone disodium (CBX) on the survival of cells treated with silica nanoparticles (SNPs) (mean, n=6).
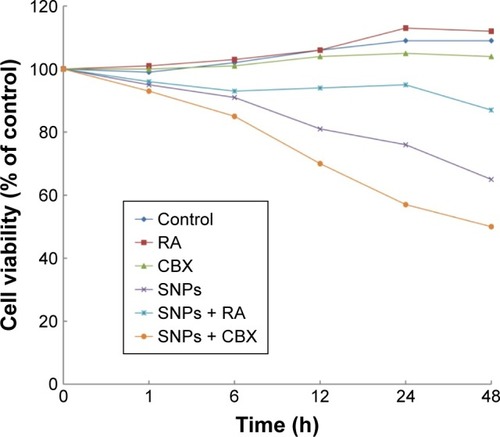
Figure 5 Effect of gap junctions modulator (activator retinoic acid [RA] and inhibitor carbenoxolone disodium [CBX]) on gap junction intercellular communication (GJIC) of H9c2 cells. (A) Modulation of GJIC in H9c2 cells. Lucifer yellow (LY, green) transferred to adjacent cells via open gap junctions. (B) The average distance of LY spread from the side of the scraped edge from six different sites in each sample was obtained for quantification. Values represent the mean ± standard deviation (n=6). aP<0.05, vs control group; bP<0.05, vs silica nanoparticles (SNPs) group.
![Figure 5 Effect of gap junctions modulator (activator retinoic acid [RA] and inhibitor carbenoxolone disodium [CBX]) on gap junction intercellular communication (GJIC) of H9c2 cells. (A) Modulation of GJIC in H9c2 cells. Lucifer yellow (LY, green) transferred to adjacent cells via open gap junctions. (B) The average distance of LY spread from the side of the scraped edge from six different sites in each sample was obtained for quantification. Values represent the mean ± standard deviation (n=6). aP<0.05, vs control group; bP<0.05, vs silica nanoparticles (SNPs) group.](/cms/asset/d74c3d6f-79ad-4e4c-b026-d16fc15e3e34/dijn_a_127904_f0005_c.jpg)
Figure 6 Effect of gap junction intercellular communication on silica nanoparticles (SNPs)-induced apoptosis in H9c2 cells determined by flow cytometry. (A) The apoptotic rate after treatment with 100 μg/mL SNPs for 24 h was determined by flow cytometry using Annexin V/PI double staining. (B) Effect of gap junction modulators (activator retinoic acid [RA] and inhibitor carbenoxolone disodium [CBX]) on the apoptotic rates. Values represent the mean ± standard deviation (n=6). aP<0.05, vs control group; bP<0.05, vs SNPs group.
Abbreviations: FITC, fluorescein isothiocyanate; PI, propidium iodide.
![Figure 6 Effect of gap junction intercellular communication on silica nanoparticles (SNPs)-induced apoptosis in H9c2 cells determined by flow cytometry. (A) The apoptotic rate after treatment with 100 μg/mL SNPs for 24 h was determined by flow cytometry using Annexin V/PI double staining. (B) Effect of gap junction modulators (activator retinoic acid [RA] and inhibitor carbenoxolone disodium [CBX]) on the apoptotic rates. Values represent the mean ± standard deviation (n=6). aP<0.05, vs control group; bP<0.05, vs SNPs group.Abbreviations: FITC, fluorescein isothiocyanate; PI, propidium iodide.](/cms/asset/057735d6-779d-4db0-ad2c-e4b7752e134f/dijn_a_127904_f0006_c.jpg)
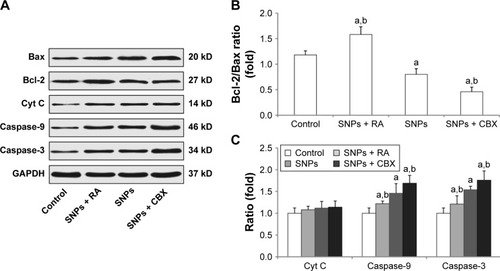
Figure 7 Effect of gap junction intercellular communication on the expression of apoptosis-related proteins following treatment with silica nanoparticles (SNPs) as determined by Western blot analysis. (A) Expression of apoptosis-related proteins in H9c2 cells following treatment with SNPs, retinoic adid (RA) combined with SNPs, and carbenoxolone disodium (CBX) combined with SNPs. (B and C) Columns are the means from densitometric scanning from blots, and bars are the standard deviation (SD). Values represent the mean ± SD (n=6). aP<0.05, vs control group; bP<0.05, vs SNPs group.