Figures & data
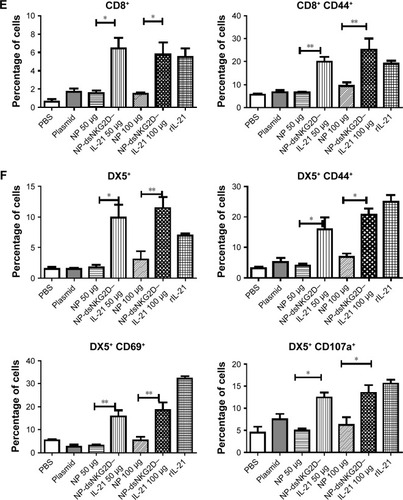
Figure 1 Generation and identification of chitosan nanoparticles encapsulated with the dsNKG2D–IL-21 fusion gene.
Notes: Agarose gel electrophoresis of supernatant solutions after nanoparticles were centrifuged with different ratios of chitosan to pcDNA3.1 (weight:weight) (A). Encapsulation rate was calculated by the ratio of the amount of DNA encapsulated into the nanoparticles to the total DNA quantities (B). Transmission electron microscopy displayed the morphology and size of nanoparticle (C). Size (D) and zeta-potential distribution (E). Each experiment was repeated at least three times. *P<0.05.
Abbreviation: IL-21, interleukin 21.
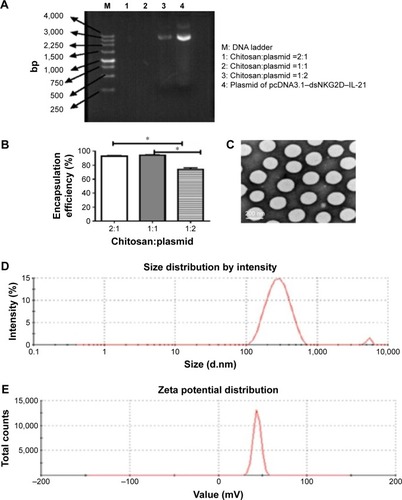
Figure 2 Identification of the secreted dsNKG2D–IL-21 protein.
Notes: Supernatants of CT-26 (A) or NIH-3T3 cell (B) pretransfected with 10% or 20% chitosan–dsNKG2D–IL-21 gene nanoparticles were collected to determine dsNKG2D–IL-21 concentration by ELISA. The NKG2D–IL-21 fusion protein of cell supernatants was confirmed by Western blot (C). Each experiment was conducted three times. *P<0.05, **P<0.01.
Abbreviations: ELISA, enzyme-linked immunosorbent assay; IL-21, interleukin 21; NP, nanoparticle; PBS, phosphate-buffered saline.
Figure 3 Stimulation of NK and CD8+ T cells by tumor cells pretransfected with chitosan–dsNKG2D–IL-15 gene nanoparticles in vitro.
Notes: CT-26 cells pretransfected with 10% or 20% chitosan–plasmid nanoparticles were cultured with mouse splenocytes overnight. Frequencies of DX5+ CD69+ (A) and CD8+ CD44+ (B) cells were detected by flow cytometry. Variations in CT-26, NIH-3T3, or RAW264.7 cell number were checked by MTS/PMS kit after cell in coculture with chitosan–plasmid nanoparticles with different quantities for 72 h. Linear relationship of nanoparticle quantity with inhibition rate of each cell type is shown (C). Numbers of cells treated by nanoparticles were assayed by the absorbance at OD490 nm (D). Each experiment was performed three times. *P<0.05, **P<0.01.
Abbreviations: IC50, half-maximal inhibitory concentration; IL-15, interleukin 15; NK, natural killer; NP, nanoparticle; PBS, phosphate-buffered saline; OD, optical density.
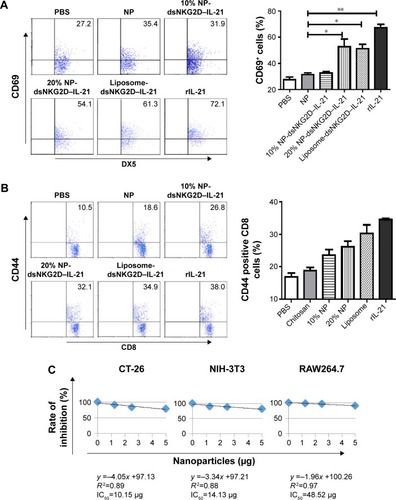
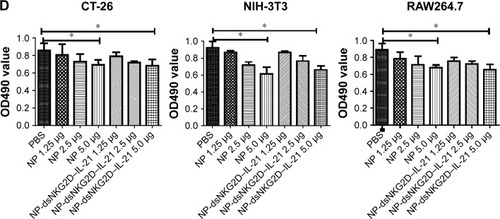
Figure 4 Activation of T and NK cells by the dsNKG2D–IL-21 nanoparticles in vivo.
Notes: Serum IL-21 levels of the mice injected with the nanoparticles intramuscularly for 3 days were detected by ELISA (A). CD69, CD44, or CD107a expression level of splenic T or NK cells was detected by flow cytometry (B–D). Each experiment was performed three times. *P<0.05, **P<0.01, ***P<0.001.
Abbreviations: ELISA, enzyme-linked immunosorbent assay; IL-21, interleukin 21; NK, natural killer; NP, nanoparticle; PBS, phosphate-buffered saline.
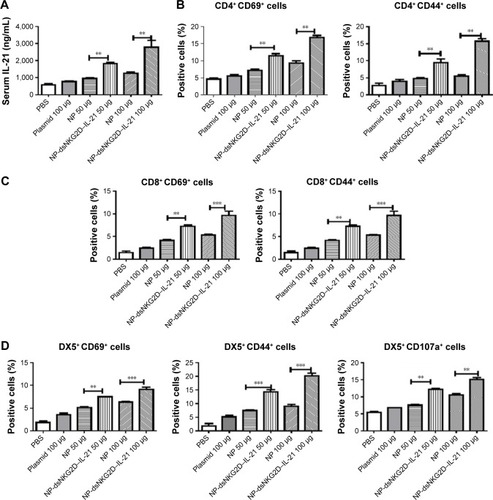
Figure 5 Distribution of dsNKG2D–IL-21 nanoparticles in tumor-bearing mice.
Notes: After CT-26 cells were subcutaneously injected into the back of C57BL6 mice for 10 days, Cy5.5-labeled chitosan–dsNKG2D–IL-21 (100 μg) nanoparticles were injected into the tail vein. Fluorescent signals in the three mice were documented as indicated (A). Fluorescent intensity of the red circle in the back of tumor-bearing mice (n=5) was compared (B). The experiment was performed twice. ***P<0.001.
Abbreviation: IL-21, interleukin 21.
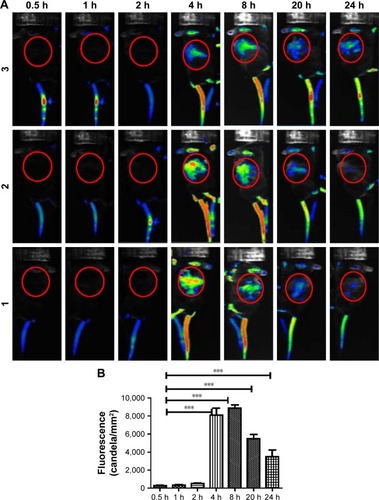
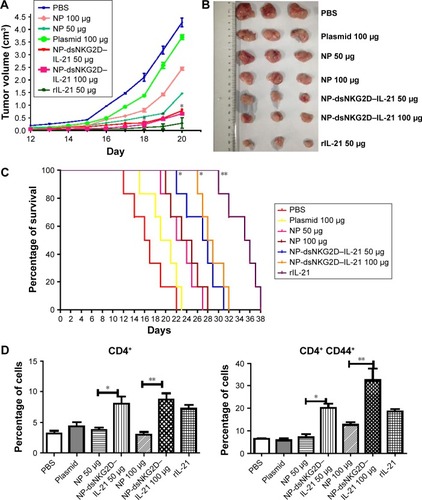
Figure 6 Antitumor activity of chitosan–dsNKG2D–IL-21 gene nanoparticles in vivo.
Notes: CT-26 cells were injected subcutaneously into the Balb/c mice (n=6, 2×10⁶ cells). On day 5, nanoparticles were injected intramuscularly every 3 days. Tumor growth was measured daily and expressed as the mean ± standard deviation (A). Tumor tissues were excised from the sacrificed mice (B). Mouse deaths were documented over time. Data are presented in Kaplan–Meier survival curves (C). All mice were sacrificed on day 20, and their spleens were collected. Frequencies of CD4+, CD4+ CD44+ (D), CD8+, CD8+ CD44+ (E), DX5+, DX5+ CD69+, DX5+ CD44+, and DX5+ CD107a+ cells in tumor tissues were detected by flow cytometry (F). The experiment was conducted three times. *P<0.05, **P<0.01.
Abbreviations: IL-21, interleukin 21; NP, nanoparticle; PBS, phosphate-buffered saline.